
Abstract
There is increasing emphasis on prevention of emergency medical readmissions. The broad pattern of acute medical readmissions was studied over a seven-year period and the impact of any readmission on 30-day mortality was recorded. Significant predictors of outcome, including co-morbidity and illness severity score, were entered into a multivariate regression model, adjusting the univariate estimates of the readmission status on mortality. In total, 23,114 consecutive acute medical patients were admitted between 2002–8; the overall readmission rate was 27%. Readmission independently predicted an increased 30-day mortality; the odds ratio, was 1.12 (95% confidence interval (CI) 1.09 to 1.14). This fell to 1.05 (95% CI 1.02 to 1.08) when adjusted for outcome predictors including acute illness severity. The trend for readmissions was to progressively increase over time; the median times between consecutive admissions formed an exponential time series. Efforts to reduce or avoid readmissions may depend on an ability to modify the underlying chronic disease.
Introduction
There has been an increasing trend of emergency medical admissions in recent decades.1–2 Similar systems for managing acute medical admissions exist across the UK and Ireland. After discharge from hospital, unplanned readmission is relatively common, with reported rates of 15.1% at 28 days from North East Thames,3 38% at six months in London,4 and 19.5% at one year from the west of Ireland.5 The rising trend in emergency readmissions is worrying, partly because of implied implications about quality of care, but also because of the burden placed on the provision of acute hospital services. The cost savings associated with shortened hospital stay are lost when patients are re-hospitalised.
There is great interest in the concept of the ‘avoidable’ readmission; many are said to cluster close to the first few weeks after an index discharge.6 Although some medical readmissions can be ascribed to factors, such as suboptimal healthcare delivery or lack of social supports, many patient- or disease-related factors also have an impact.7 The hypothesis that many readmissions are preventable is not established and the contribution of fresh events, in patients with chronic illness and frequent co-morbidity, must be considered. The use of readmissions as a benchmark of quality is controversial; it may be a poor guide to quality of care without correction for medical, social and demographic factors.8
Many studies are of limited duration with very little data on the mortality among readmitted patients. In an attempt to address some of these questions from a longer-term perspective the pattern of admissions to St James's Hospital Dublin, were examined. A ‘readmission’ was defined as any emergency medical readmission in the seven years from beginning of 2002 to end of 2008.
Methotitles
Background
St James's Hospital (SJH) operates a continuous sectorised acute general medical ‘take-in’ serving as a secondary care centre for emergency medical admissions for its local Dublin catchment area. All patients requiring hospitalisation under the general medicine ‘on-take’ physician were included in the analysis. In 2003, two of the modern centrally located medical wards were reconfigured to function as an acute medical admission unit (AMAU) where all acutely ill medical patients are received. The operation and outcome of the AMAU to 2007 has been described by Rooney et al.9 The definition of mortality used was an inpatient death, irrespective of cause.
Data collection
A patient database linked the computerised patient administration system (PAS) to the hospital inpatient enquiry (HIPE) scheme. HIPE is an Irish national database of coded discharge summaries from acute public hospitals. Ireland has used the International Classification of Diseases, Ninth Revision, Clinical Modification (ICD-9-CM) for both diagnosis and procedure coding from 1990 to 2005 and ICD-10-CM thereafter.10 Linking the HIPE dataset with the PAS dataset permits the application of routinely collected data for the purposes of research, planning and quality control. Data collected includes hospital number, patient's name, admission and discharge dates, date of birth, gender, area of residence by county, principal diagnosis, up to nine additional secondary diagnoses, procedures and admitting consultant. Additional information uploaded to the database included physiological, haematological and biochemical datasets relating to the admission. The HIPE dataset of all coded diseases at time of discharge/death, together with procedures and investigations undertaken during the hospital stay was examined. Data were related to all emergency medical patients admitted to SJH between 1 January 2002 and 31 December 2008. The unique identifier and date of admission were used to number consecutive admission.
As previously described,11 an acute illness severity score has been developed that predicted an in-hospital death from the following nine parameters recorded in the emergency department: age, respiratory rate, oxygen saturation and routine laboratory tests (ie serum sodium (Na), serum potassium (K), serum urea, serum albumin, red cell distribution width (RDW) and white blood cell count (WCC)). The regression model utilised the 2002–6 dataset for derivation and the 2007–8 data for validation. The area under the curve (AUROC) to predict an in-hospital death at five days was 0.94 in the derivation (n=5,334) and 0.90 (n=2,784) in the validation dataset and at 30 days 0.88 (n=10,763) and 0.86 (n=6,213) respectively.
Statistical methods
Descriptive statistics were calculated for background demographic data, including means/standard deviations (SD), medians/interquartile ranges (IQR) or percentages. Comparisons between categorical variables and mortality were made using chi-square tests. Logistic regression analysis was used to examine firstly the univariate risk of a readmission on 30-day hospital mortality; this risk estimate was then adjusted for gender, major disease by category (MDC), Charlson co-morbidity index, an ICU admission, a blood transfusion, any troponin elevation, the quarter of year, door-to-team time and the impact of AMAU (two consecutive periods before/after 30 March 2005). Finally, the 30-day risk estimate was adjusted for acute illness severity score. Odds ratios (OR) and 95% CIs were calculated where appropriate. Statistical significance at p<0.05 was assumed throughout. JMP version 7 statistical software (SAS Institute Inc) was used for analysis.
Resultitles
Patients
In total, there were 23,114 patients admitted acutely via the emergency department between 1 January 2002 and 31 December 2008. Of these, 6,271 patients had at least one readmission, and there were a total of 16,999 readmissions. The episodes recorded represented all medical admissions during the observation period, including patients admitted to the intensive care unit (ICU) and high dependency unit (HDU). The patients' gender, their median age and length of stay are shown in Table 1. The median number of admissions was two (IQR 2,3); 10%, 2.5% and 0.5% of patients were admitted on more often than five, 10 and 18 occasions respectively.
Details of emergency medical admissions 2002–8.
The overall readmission rate over the seven years was 27%. The median length of stay (LOS) per episode for single admissions only was 4.1 days (95% CI 1.6 to 8.7) and for readmissions significantly longer at 5.8 days (95% CI 2.7 to 10.6: p<0.0001). The median time to a readmission was 61.1 weeks (95% CI 19.4 to 131.6). Only 10% and 2.5% of readmissions occurred within four weeks and 0.5 weeks respectively. Readmitted patients were older: their median age 67.2 years ν 58.2 years for all patients.
Among all admitted patients, the primary diagnosis was respiratory system (22%), circulatory system (16.7%), digestive system (11.5%) or nervous system (17.3%). In readmitted patients, the proportion of respiratory system diagnoses was higher (26.8%) but the proportion of nervous system diagnoses lower (14.2%).
Mortality in readmissions
The mortality for a readmission (calculated on unique patients using the only or last episode) was 15.4% ν 8.2% for a patient with one episode only (p<0.0001). Between 2002 and 2008, for patients with a single admission the 30-day in-hospital mortality fell progressively from 12.6% in 2002 to 4.9% in 2008 (p<0.0001). For readmissions the mortality fell similarly from 23.6% in 2002 to 9.0% in 2008 (p<0.0001).
Time patterns in readmissions
Table 2 illustrates how readmissions increased over time. The non-parametric Wilcoxon Kruskal–Wallis can be used to infer these trends; the standardised difference statistic is the median difference divided by a measure of the pooled variance. The standardised difference progressed from highly negative numbers (lower rates) to highly positive values (higher rates) over the seven years.
Readmission progressively increased with time.
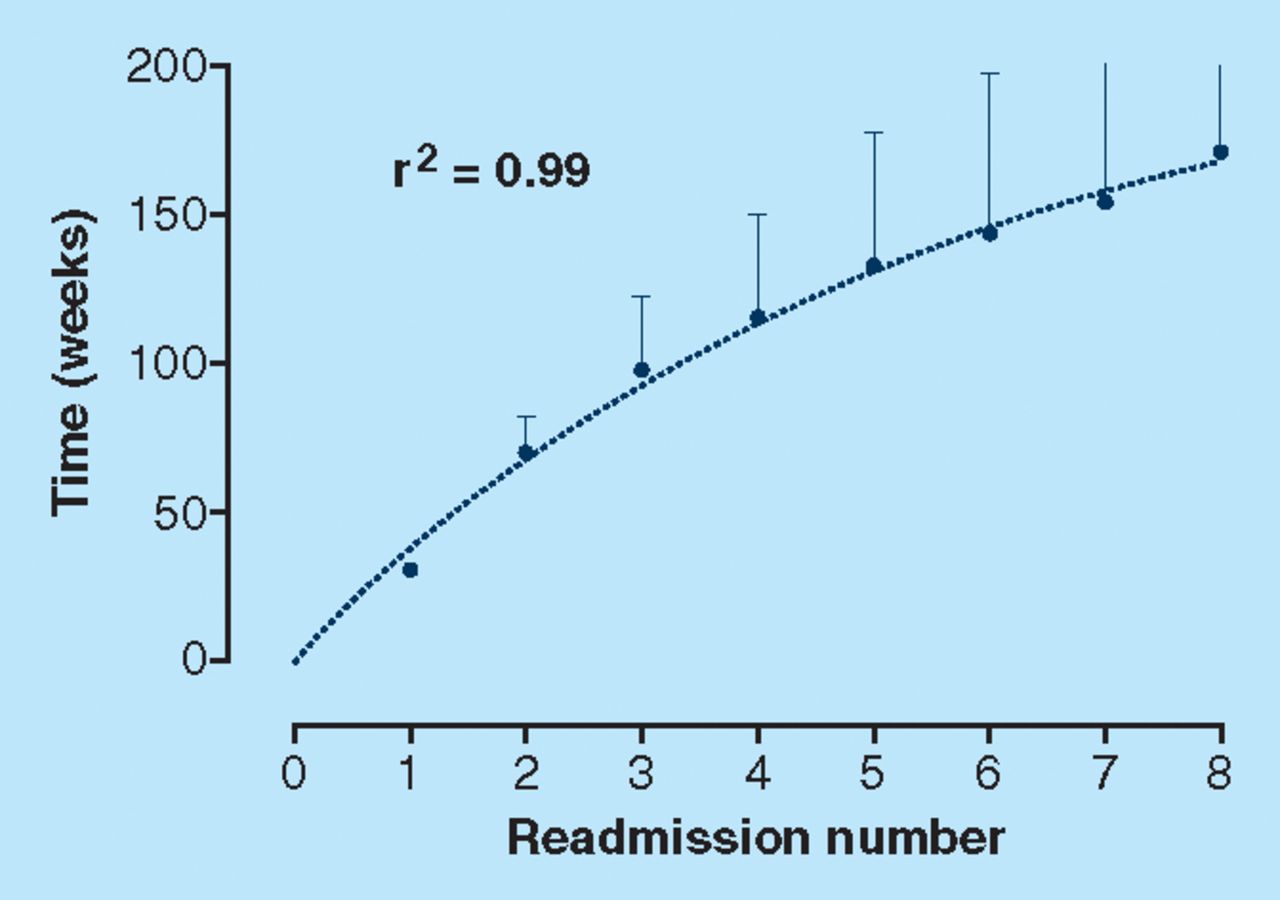
Figure 1 is an analysis of the time from the first to each subsequent admission. The median time was calculated in weeks between the first and each subsequent admission. A mathematical model, a one-phase exponential association, perfectly fits the medians of the first eight readmissions, with a correlation coefficient of 0.99. As time advances the duration between consecutive admissions progressively shortens.

Data show the median time to readmission (weeks) and 95% confidence interval. The time to admission closely fits to an exponential model (n=16.999).
Relationship of readmissions to 30-day mortality
Overall the univariate OR for mortality of a readmission, unadjusted for other outcome measures predictors, was 1.12 (95% CI 1.09 to 1.14). The adjusted OR for a readmission, was essentially unaltered 1.11 (95% CI 1.08 to 1.14)) when adjusted for all factors excluding acute illness severity but was sharply adjusted down to 1.05 (95% CI 1.02 to 1.08), when adjusted for all factors including acute illness severity (Table 3).
Predictors of an in-hospital death at 30 days.
Table 3 presents data from the logistic regression model; this illustrates significant predictors (covariates) of 30-day mortality, including illness severity. The OR for the Charlson co-morbidity index was 1.30 (95% CI 1.24 to 1.37); this is interpreted as a 30% increased risk for death at 30 days, with an increasing co-morbidity burden (0–6 range). The acute illness severity score was a very powerful predictor of outcome; there is a 61% increase in 30-day mortality for each decile of calculated risk, OR 1.61 (95% CI 1.56 to 1.67).
Discussion
There has been a relentless increase in emergency medical admissions in the UK in recent years.1 Similarly, unplanned emergency readmissions have also risen.12 The growing number of elderly patients in the population may be partly responsible for this rise since admission rates increase dramatically with age, especially for those living alone.13 This places a burden on the acute hospital services as patients return for the most expensive health service, acute inpatient care. In addition, the rising trend in readmissions raises questions about the quality of care. The length of the inpatient stay has shortened significantly in recent years and this has led to fears of incomplete care or inappropriate discharge from hospital.14
Therefore readmission is used as one of a number of quality indicators within a hospital.8 While some readmissions are indeed due to suboptimal healthcare delivery or social supports, many patient or disease factors exert a strong impact. A recent UK study concluded that 71% of readmissions within two weeks were potentially avoidable.15 However, other researchers have demonstrated that relapse of an underlying medical condition is responsible for the majority of emergency readmissions and that significantly more patients with chronic disabling conditions are readmitted than others.6 Therefore the extent to which readmissions are preventable deserves to be based on evidence rather than opinion.
In this study 23,114 consecutive acute medical admissions were analysed over a seven-year period. Overall 6,271 (27%) were readmitted. This rate is not unexpected given the long duration of follow-up among a catchment area that includes a large elderly population and areas of social disadvantage. An effective comparison with the published literature is difficult in view of the variable definition of a medical readmission, with time frames extending from two weeks to nine years in some studies. Reported readmission rates range from 15.1% at 28 days from North East Thames3 to 23.3% at one year from Manchester.7 The focus in many studies is on so-called ‘preventable readmissions’ which are often considered to be those patients readmitted within one month. Some studies conclude that these patients were discharged too early and that more optimal clinical care could have avoided the need for readmission.16 However, only 10% of readmissions occurred within four weeks in this study. Furthermore, readmitted patients stayed longer in hospital than those admitted for the first time. This has been a fairly consistent finding in the literature.17 In addition, the effect of an AMAU on mortality in our institution has been previously published.9 From 2002 to 2006, all-cause in-hospital mortality fell from 12.6% to 7%. The corresponding mortality for readmissions also fell from 23.6% in 2002 to 9.0% in 2008. Importantly, mortality remained independently associated with structural changes, ie the AMAU, introduced over the period 2003–6. This reduction in mortality occurred over much the same period as the current readmission examination adding further weight to the argument against a poor clinical performance.
The patient and disease profile of readmitted patients in our institution has also been described.13 Readmission was more likely among older patients, men and those who received a discharge coding diagnosis of heart failure, chronic respiratory disease, alcoholism, malignancy and anaemia. This study has examined the trend of acute medical readmissions over a seven-year period and found that the median time to each consecutive readmission lies on an exponential curve – a pattern compatible with a biological phenomenon. Furthermore the time between each successive admission becomes progressively shorter as time advances. This is compelling evidence that readmission rates are a fundamental expression of a chronic disease process. As the chronic disease advances over time, with acute deteriorations, there is an increasing need to access acute inpatient care. Therefore unforeseen readmission may be largely a consequence of the natural course of the patient's disease rather than a reflection of suboptimal care during the first or subsequent admissions.17–18 Unless the course of the disease can be altered or fresh events can be treated elsewhere, eg the patient's home, hospital readmission may be inevitable.
The impact of hospital readmission among medical patients on mortality has not been well studied. A recent study of elderly patients found that the mortality was six times higher among early readmitted patients than among others (26% ν 3.9%) during the three months after the index admission.19 The effect of readmission to the intensive care unit (ICU) on hospital mortality is far better studied. Numerous studies have reported a higher mortality rate for patients readmitted to ICU with a recent US paper confirming that hospital mortality was five times higher (43% ν 8%; p<0.0001), and length of stay was doubled (16 +/− 16 ν 32 +/− 28 days; p<0.001) among ICU readmissions.20–21 An 11% increase in mortality at 30 days per acute medical readmission has been demonstrated. This significant increase is essentially unaltered when adjusted for multiple other impacting factors, for example age, disease category, Charlson co-morbidity index and so on. However, when adjusted for acute illness severity score, the effect attributable to the readmission was approximately halved. These data suggest that readmitted patients are frequently sicker than those admitted for the first time and therefore more likely to die. These findings are in keeping with the theory of advancing chronic disease driving the readmission process.
In conclusion, emergency medical readmission confers a significant increase in hospital mortality. In addition, medical readmissions are a highly time-dependant phenomenon reflecting the natural progression of chronic disease over many years. Therefore the use of acute hospital readmission as an indicator of quality of care must be done with caution and only after adjustment for severity of disease along with medical, social and demographic factors. Many hospital readmissions are not preventable without significant investment in the management of chronic disease and the treatment of fresh events outside the acute hospital setting.
Acknowledgements
We wish to recognise the contribution of our consultant medical colleagues and the non-consultant members of ‘the on-call’ teams without which this initiative could not have progressed. The dedicated contribution of Sr Donnelly, the clinical nurse managers and ancillary medical professionals in the AMAU is gratefully acknowledged.
- Royal College of Physicians


