
ABSTRACT
The performance of acute medical units (AMUs) against published quality indicators is variable. We aimed to identify the impact of case-mix and unit resources on timely assessment and discharge of patients admitted to 43 AMUs on a single day in June 2013, as part of the Society for Acute Medicine's benchmarking audit 2013. Performance against quality indicators was at its worst in the early evening hours. Units admitting fewer than 40 patients performed better. Patients who were more frail, as measured by the Clinical Frailty Scale, were also more likely to have significant physiological abnormalities and a higher risk of death, as measured by the National Early Warning Score. Our analysis suggests that resource allocation at the front door is related to quality indicators. Teams will need strengthening in the evening hours and if looking after higher numbers of frail patients.
Introduction
Unscheduled care has once again been under sustained pressure this winter. Clinicians have tried to stem the seemingly endless tide of emergency admissions but have often felt overwhelmed and unable to deliver the quality of service to which they aspire. There is only limited research that puts this clinical experience at the front door of acute medical units (AMUs) into numbers. The Society for Acute Medicine (SAM) has set standards1 and quality indicators2 against which we have performed national audits in 20123 and 2013.4 In these audits we reported the variability in unit performance for the time that it took patients admitted through an unselected medical take to be seen by a junior or senior doctor and the availability of first-line investigations.
Although SAMBA ‘12 and SAMBA ‘13 recorded only 24 hours of activity in the participating units, we believe that our observations are likely to be representative of the experience that patients will have on admission to hospital. The feedback of patients is not always positive: Sullivan et al5 reported that many patients who are admitted to departments of medicine in the UK feel that there is space for improvement.
To advise hospitals on how they can improve the experience that patients have, it is likely that several approaches are needed: structured case studies of the units with the best performance could serve as examples for learning. More robust measures of case-mix adjustment are likely to be required to establish what works on the shop floor.
In the current paper we aimed to examine potential confounders of performance: It was our aim to investigate the impact of case-mix and unit set-up on SAM's quality indicators in the data-set submitted for SAMBA ‘13.4
Methods
Data collection for the audit consisted of two primary parts. First, the SAM research committee members designed a data collection form that required completion for each patient admitted to the acute hospital over the 24-hour period 00:00–23:59 on 20 June 2013. Experiences from SAMBA ‘12 were adopted in the design of this proforma. The second phase of data collection was a Survey Monkey questionnaire, set up to collect more generic centre data. This focused specifically on staffing levels for medical, nursing and allied health professionals working in the AMU on the day of the audit. Centres that were unable to complete the information online were later contacted by email and requested to complete a tabulated version of the survey (see supplementary material online).
Recruitment of centres
The SAMBA ‘13 audit was publicised at the Society of Acute Medicine's conference, Coventry, May 2013. All hospitals running an unselected acute medical take were invited to participate in data collection. Non-acute or community hospitals were unable to take part.
Standards surveyed
Standards against which the audit was performed have been published previously.4
The National Early Warning Score (NEWS6) was calculated from raw physiological data submitted by units. These data did not include an AVPU (alert, voice, pain, unresponsive) score. The Clinical Frailty Scale (CFS7) (Fig 1) was derived from information collated in nursing and medical notes (http://geriatricresearch.medicine.dal.ca/pdf/Clinical%20Faily%20Scale.pdf).
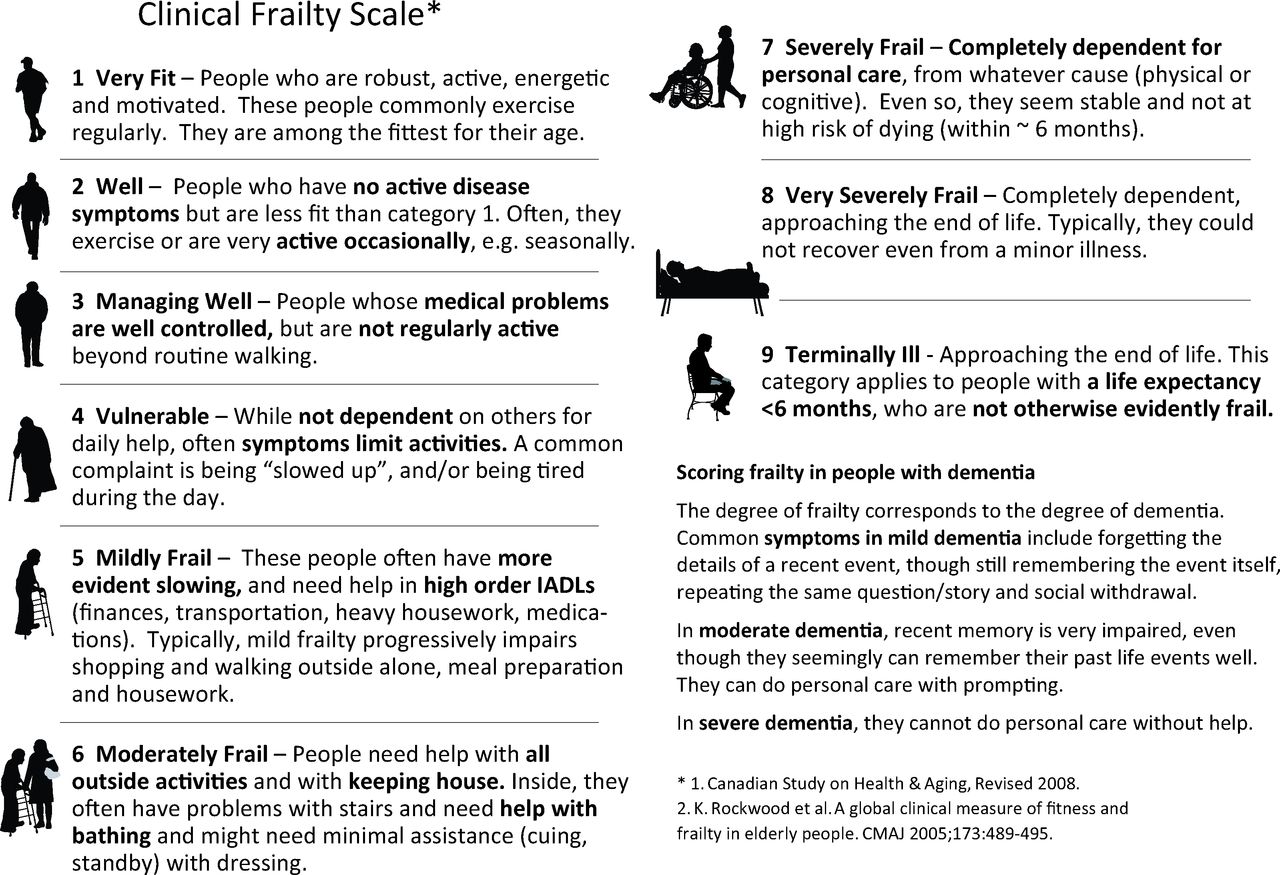
Clinical Frailty Scale.7 © 2007–2009. Version 1.2. All rights reserved. Geriatric Medicine Research, Dalhousie University, Halifax, Canada. Permission granted to copy for research and educational purposes only.
Ethics
The study was reviewed by the North Wales Research Ethics committee and classified as an audit.
Funding
No dedicated funding was available for this audit
Statistical analysis
Microsoft Excel was used for data collection and graphic representation of data.
The statistical analysis was performed using SPSS Statistics Version 20.
Results
For SAMBA ‘13, 43 hospitals contributed data from 1,425 patients; 54% of acute medical admissions were female and the mean age of admissions was 65 years (standard deviation (SD) 20). Early warning scores were recorded within the first half hour of admission to hospital in the AMU or accident and emergency department (A&E) in 76%. Patients were seen by a doctor within 4 hours in 95%, and a consultant saw patients in line with SAM's recommendations in 79%.
Impact of NEWS on performance
In 1,304 patients vital signs were available that allowed the calculation of a NEWS without an AVPU score. The mean NEWS was 2.3 (SD 2.5). Of scores, 84% were in the band 0–4, and 8% had a NEWS ≥7. The percentage of patients in any unit with a NEWS ≥7 varied between 0 and 23%. Patients admitted from the A&E were sicker than those admitted from primary care: 25 of 500 admissions from primary care and 81 from 730 admissions from A&E had NEWS ≥7 (p < 0.001).
NEWS was associated with discharge from the AMU: 170 (53%) of patients with a NEWS of 0 were discharged directly from the AMU; of patients with a NEWS <7, 43% went home, as opposed to 7% of patients with a NEWS ≥7 (p < 0.0001). There was no correlation between the length of stay of patients in the AMU and the level of their NEWS score (p = 0.94). No patient who was seen in ambulatory care had a NEWS ≥7.
Performance against SAM's quality indicators was better in patients with a higher NEWS (p < 0.03) due to better compliance with a medical review within 4 hours.
Impact of the Clinical Frailty Scale on performance
The Clinical Frailty Scale was recorded in 1,390 patients. Of patients 69% were thought to have no significant frailty issues; 144 (10%) patients were mildly frail, 150 (11%) moderately frail, 94 (7%) severely frail, 24 (2%) very severely frail and 13 (1%) terminally ill. The percentage of patients in any unit with mild or more significant frailty varied between 7 and 54%. Of 965 patients, 474 (49%) without frailty issues were discharged home from the AMU as opposed to 88 of 425 (21%) patients with frailty issues (p < 0.0001). Ten per cent of patients without frailty issues were seen in ambulatory care as opposed to 3% of patients with frailty issues (p < 0.0001). There was no difference in the percentage of frail patients from primary care and A&E (159/534 (30%) vs 250/771 (32%), p < 0.3).
Performance against SAM's quality indicators was independent of the level of frailty.
Relationship between severity of illness as measured by NEWS and frailty
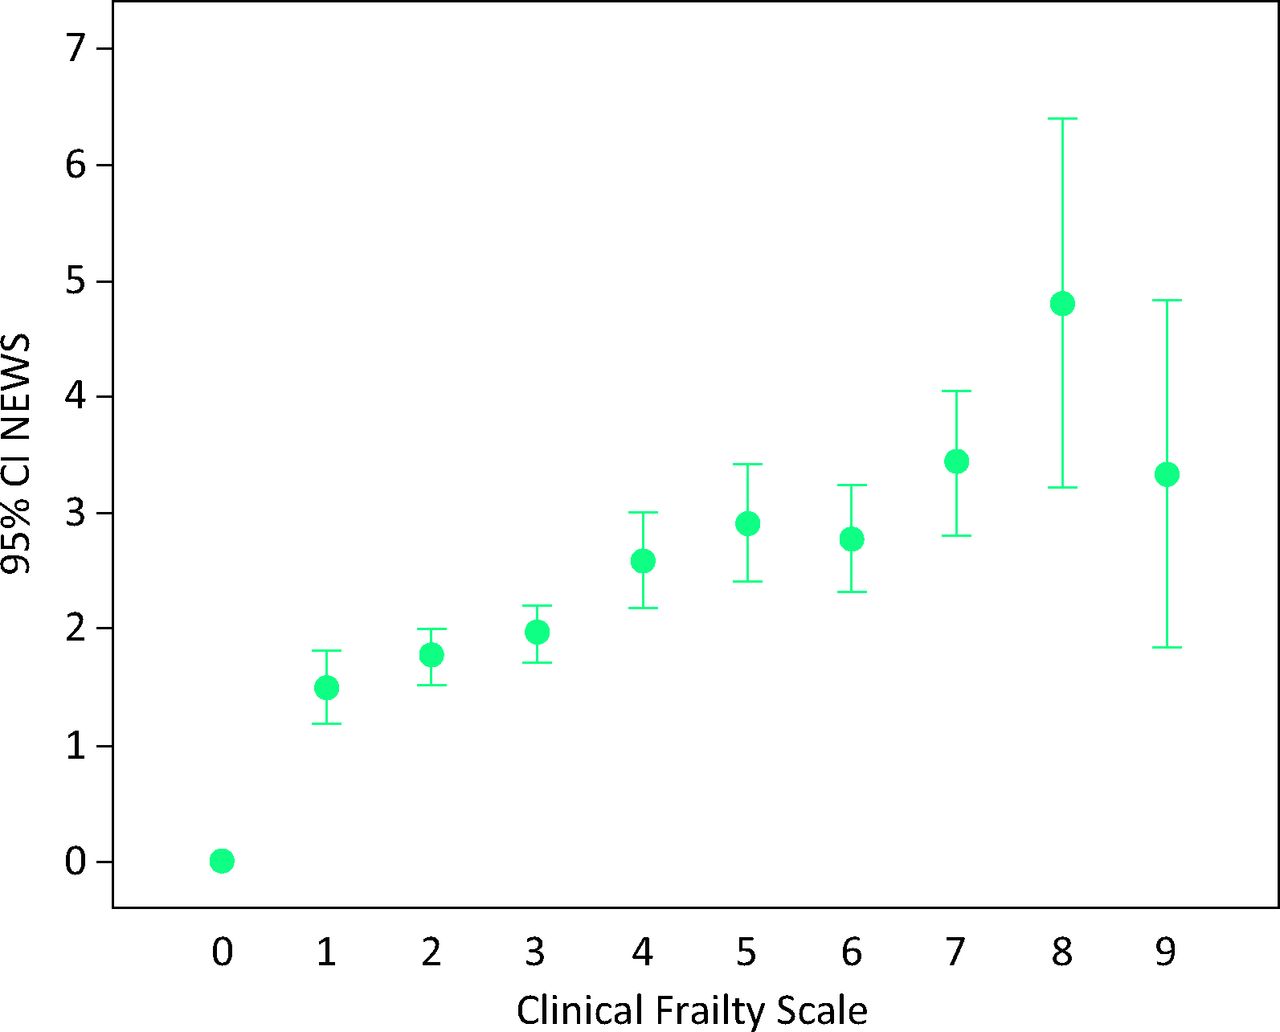
Four hundred and forty-three patients scored ≥7 on NEWS or had frailty issues. This group is likely to require a higher level of care from nursing staff. The total percentage of patients in this group per unit varied between 8% and 67%. NEWS and CFS did correlate: frail patients were also sicker as measured by NEWS (Spearman's ρ = 0.234, p < 0.001) (Fig 2).

Relation of value for the National Early Warning Score (NEWS, without AVPU score) and the Clinical Frailty Scale. CI = confidence interval; SAM = Society for Acute Medicine.
Impact of unit and take size
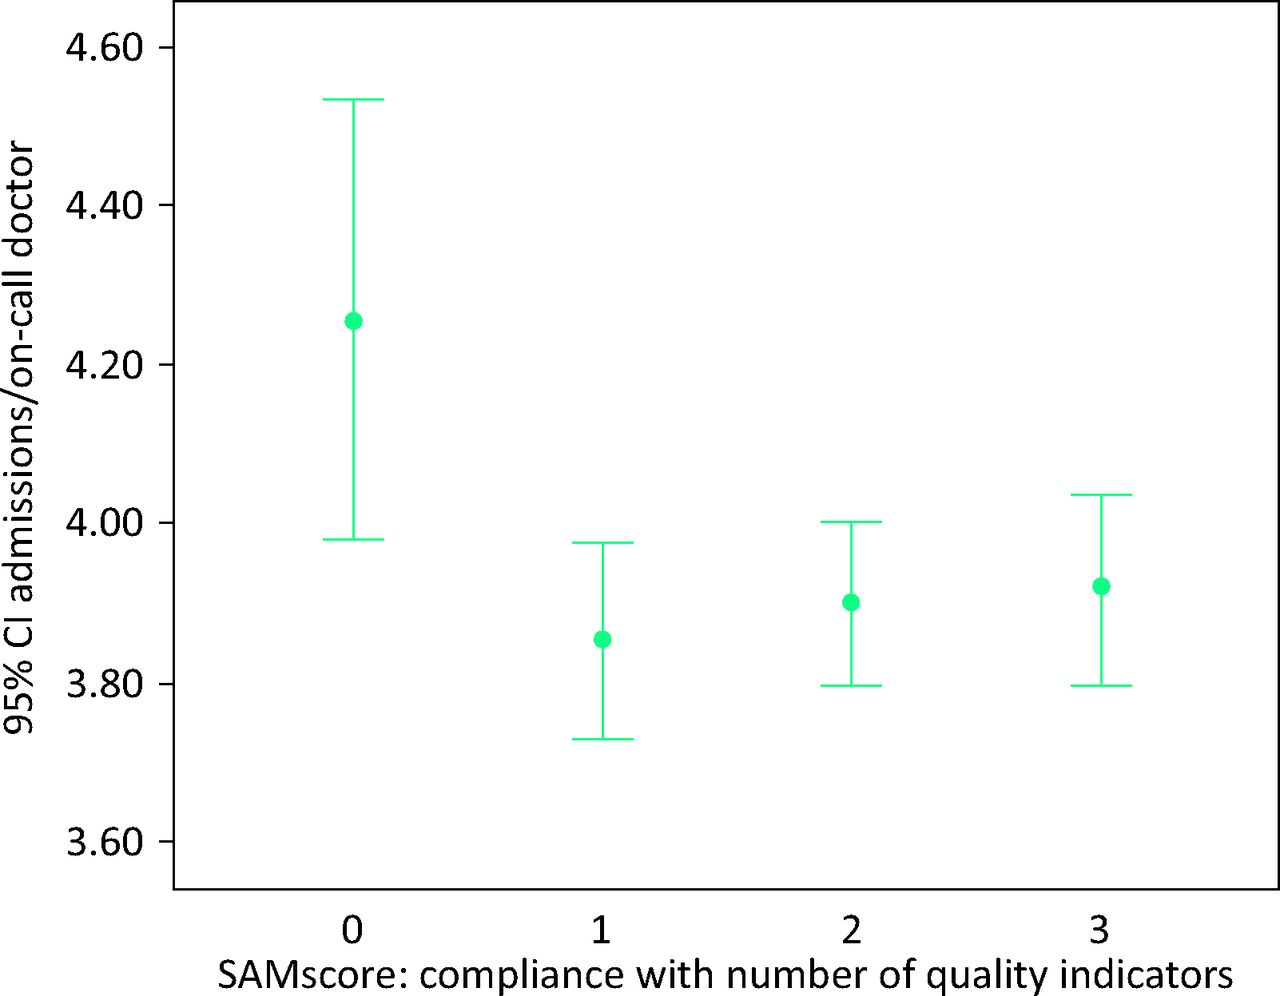
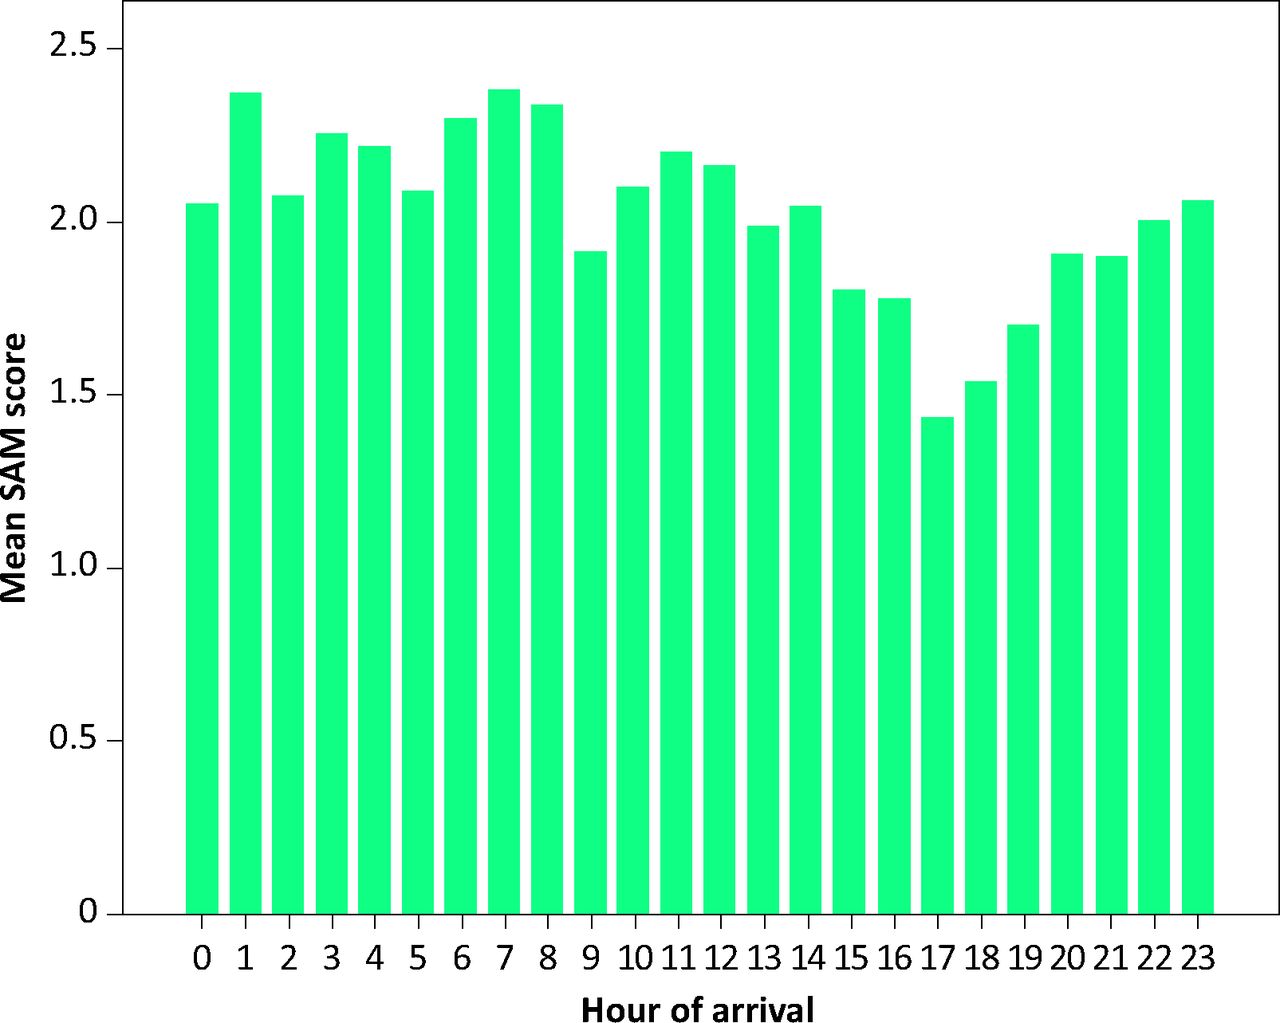
The median number of combined beds in AMUs and short-stay units was 50. The median size of the take was 39 patients. Units with smaller AMUs (<50 beds) achieved all three SAM quality indicators in a higher percentage of patients (265/794 (33%) in smaller vs 114/463 (25%) in larger units; p < 0.001). Units with smaller takes (<40 patients) achieved all three SAM quality indicators in a higher percentage of patients (271/783 (35%) in smaller vs 179/642 (28%) in larger takes; p < 0.001). Binary logistic regression suggested better performance in units with fewer than 40 patients per day and patients admitted via their GP. The relationship between the take size and the number of beds did not affect performance. Regression analysis suggested that performance was independent of the number of consultants on-call and of specialist registrars (SpRs) and senior house officers (SHOs) during day or night shifts (Fig 3). Performance against quality indicators was best in the early morning (6:00–9:00) and worst in the early evening hours (15:00–21:00) (Fig 4).

Workload of junior doctors and quality indicators. In patients in whom no quality indicators were achieved, the number of admissions per junior doctor on-call was more than four. This relationship was not statistically significant. CI = confidence interval; SAM = Society for Acute Medicine.

Performance against quality indicators per hour. SAM's score denotes the mean number of quality indicators adhered to. The hour of arrival is that of arrival in hospital. SAM = Society for Acute Medicine.
Patients admitted via GPs achieved a higher percentage of all three quality indicators (249/545 [46%] in patients seen by GPs vs 170/793 (21%) in patients seen in A&E; p < 0.001) due to earlier consultant reviews.
Readmissions
Two hundred and four patients (14%) had been admitted in the previous 28 days. In seven units more than a quarter of patients were readmissions. Binary logistic regression, taking into account age, sex, NEWS, CFS, presence of dementia, size of take, size of hospital, number of doctors and mode of admission, showed that only a CFS of five or more was significantly related to the risk of readmission (p < 0.028).
Comparison with SAMBA ‘12
Most SAM quality indicators improved between the two audits. There was, however, a deterioration in compliance with standards for early diagnostic procedures: computed tomography (CT) for strokes, gastroscopy for gastrointestinal bleeds and CT-pulmonary angiography for suspected pulmonary emboli (Fig 5).
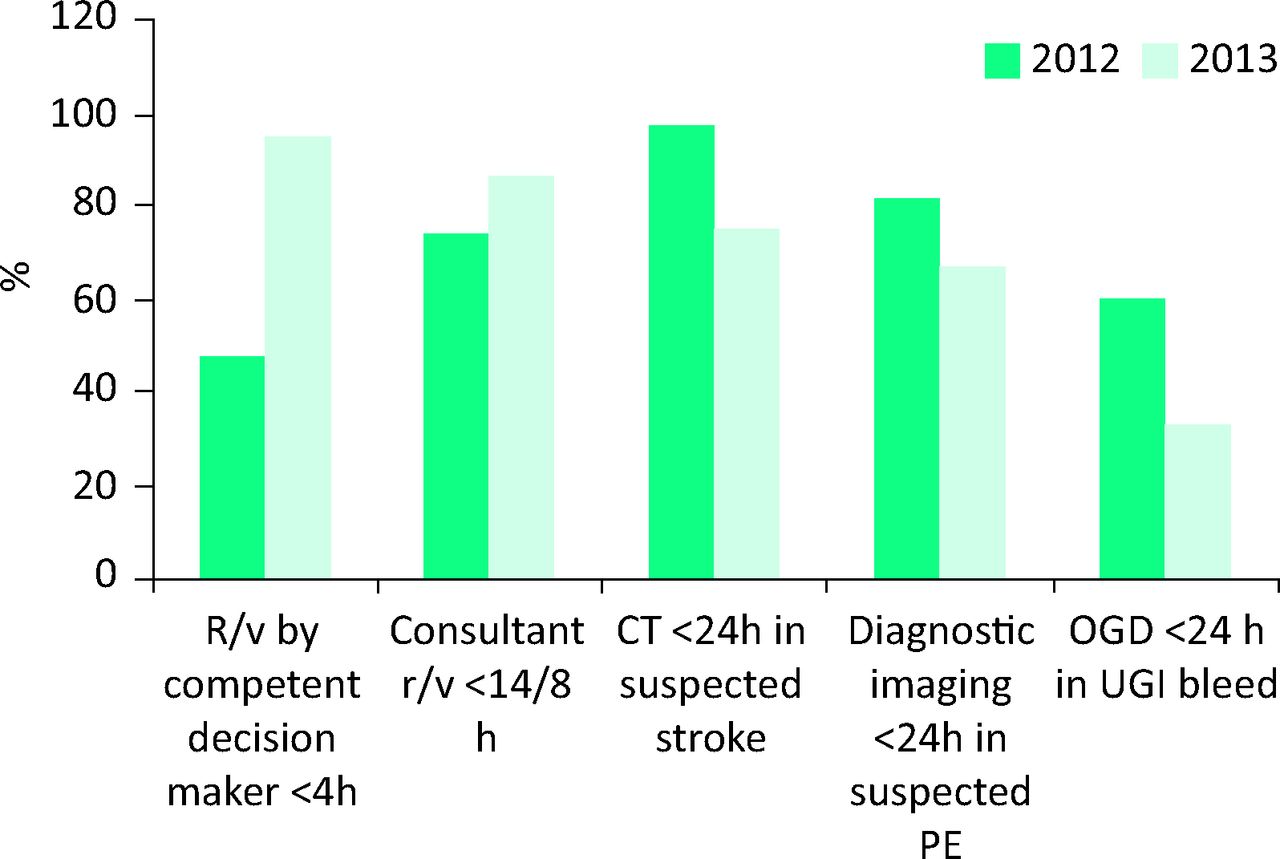
Performance against key indicators between SAMBA ‘12 and ‘13: compliance with standards in the two data-sets. CT = computed tomography; OGD = oesophagogastroduodenoscopy; r/v = review; SAMBA = Society for Acute Medicine's benchmarking audit; UGI = upper gastrointestinal bleed.
Discussion
Our main findings from the re-examination of the SAMBA ‘13 data can be summarised with three headlines.
Patients who were frail also had higher severity of illness as measured by NEWS.
Performance was not necessarily better in units with more beds, larger takes or more doctors.
Performance was worst in the evening hours.
Although reported data about medical staffing for the acute take was highly heterogeneous, the impression was that the underlying cause for this might be the ratio of doctors to new patients per hour.
The association between NEWS and frailty in this study was weak but the authors believe that the finding is probably clinically significant. Frail patients might be sicker because they present later to hospital (lead-time bias) or their ability to compensate for physiological derangement is impaired. This has potential implications for the way that primary and secondary care triage appointments and prioritise care.
The impact of admissions to hospital at night and at weekends have been described before.8–11 We have now shown that quality indicators are worse in the evening hours, possibly contributing to ‘unfinished business’ from the day carried over to the night team. In addition, we would expect that queuing for the results of diagnostic tests will increase over time and would delay processes more in the latter half of the working day.
Our audit captures only a single day from a quarter of UK AMUs. Although there is a chance that units have prepared for the day to present better data, it appears that this would still leave ample scope for improvement.12 We are unsure to which degree performance on other days of the week or during winter months would be predictable from the data for a weekday in June. We were, however, sceptical that units would be able to take part in an undertaking of this scope during times of peak demand on the clinical workforce.
The diurnal variation of performance is perhaps expected. It will be up to clinicians to find ways to schedule senior and junior staff, as well as diagnostic support, in a way that allows a more reliable patient experience. Our findings lend further weight to the argument for service redesign in the light of the work from the Future Hospitals Commission.13
With SAMBA ‘13 we have created a simple benchmarking tool against which units can measure their own performance. We are hoping for clinicians to come forward with innovative ideas to show that they can improve against their peers and historic performance. The new climate of increased scrutiny of performance14,15 and a call to openness16 should allow us to share these types of data freely in order to learn from each other, with the clear aim of delivering better care to our patients. Acute medicine as the specialty that forms the hub of modern hospitals has the big opportunity17 and the heavy duty to take charge of the drive for improvement.
Acknowledgements
Professor Kenneth Rockwood generously allowed us to use the Clinical Frailty Scale for the study. We are extremely grateful for his support and critical comments. Claire Charras, at the Society of Acute Medicine's head office in Edinburgh, kindly set up the internet resource and fielded questions. The authors would like to thank the over 100 colleagues from across the UK who joined SAMBA ‘13 in reviewing the study outline, collecting data and collating results (see supplementary material online).
- © 2015 Royal College of Physicians


Jump to section
Related Articles
Cited By...
- No citing articles found.