
ABSTRACT
We have previously described an open-source data-driven modelling technique that has been used to model critical care resource provision as well as expanded to elective surgery and even whole-hospital modelling. Here, we describe the use of this technique to model patient flow and resource use across the West Yorkshire Critical Care Network, with the advantage that recommendations can be made at an individual unit level for future resource provision, taking into account changes in population numbers and demography over the coming decade. We will be using this approach in other regions around the UK to help predict future critical care capacity requirements.
Introduction
The need for a massive expansion in critical care during the first year of the Coronavirus 2019 (COVID-19) pandemic brought into focus the long-standing view that the UK has a relative underprovision of critical care resources compared with other high-income countries.1 Expansion of critical care in the UK has historically largely occurred without regional coordination, which can result in resources inefficiently distributed around regions. Our aim was to build on previously published modelling work2 using a data-driven technique to make recommendations on service expansion for each hospital trust within West Yorkshire.
Our modelling technique is a bottom-up data-driven approach that treats patients as individuals and uses each patient's resource use to drive a discrete event simulation (DES) model. As described previously, Markov chain approaches, using patient states with estimated probabilities of transition, or other statistical approaches reducing patient data to numerical parameters, run into issues trying to categorise heterogeneous patients requiring critical care.2–5 By contrast, our method avoids this by effectively bootstrapping; that is, using data sampled from real patients to directly provide, rather than try to generate, a realistic distribution. Therefore, we refer to this approach as a ‘bootstrap model’.
As the model simulates patient movement and resource requirements, data can be generated on outcomes of interest at a unit level. A Monte-Carlo6 approach, with the model run repeatedly to generate a distribution of outcomes, then enables the likely range and distribution of these outcomes to be estimated for the generation of reports and recommendations. It has been used to model intensive care units (ICUs) as well as an entire hospital both before and during the pandemic, and learning has been applied in other countries and health systems.7
The slow increase in critical care bed provision in England over the past decade has only maintained the status quo.8 Although it is correct to debate what level of critical care provision is appropriate and affordable for our society, any expansion of critical care beds in the future should be done intelligently, matching new beds with local demand to both prevent unnecessary movement of patients and abolish any regional inequality of provision.
West Yorkshire comprises six NHS trusts. One large tertiary trust is split over two sites covering medical, surgical, cardiothoracic, neurosurgical and liver transplant services utilising their 78 physical critical care beds. The five other trusts with between seven and 24 physical critical care beds each support secondary and some tertiary services. The West Yorkshire population has grown rapidly over the past 20 years, from 2.06 million people in 2000 to 2.33 million in 2019, and is predicted to continue to grow over the next decade.
Method
A model for West Yorkshire Critical Care Network (WYCCN) requirements was constructed based on our previous work using a novel bootstrap method to model both a single ICU and an entire hospital, as well as other services during the COVID-19 pandemic.2 This method allows understanding of the interdependencies of different resources, such as the ability of WYCCN to cope with local peaks of demand by transferring patients within the region, and also the existence of specialist services necessitating transfer for clinical purposes. Source code and a teaching package for the underlying modelling method are publicly available.9 The single ICU model was extended by incorporating multiple modelled ICUs in a network, and by resampling patient data in both number and complexity to represent predicted population changes over the next decade.
Data
Anonymised Critical Care Minimum Dataset (CCMDS) data were requested from each ICU in WYCCN from 1 January 2016 to 31 January 2020 inclusive, representing routine activity before the pandemic. In total, 35,624 patient stays were included, with 27,844 from general critical care and 7,780 from specialist units. Fields used were admission date and type, the age and sex of the patient, and the number of days at each level of care. We also collected data on any ‘unmet need’ assessments from each unit, including the need for non-clinical interhospital patient transfers and cancelled elective surgery.
Resource availability was assessed by interview on visits to each unit (Table 1). As with previous modelling, we did not use the traditional UK levels of care, where level 2 is support for a single organ system, and level 3 is advanced respiratory or multiple organ system support. We defined a bed as a physical bed within each unit whether staffed or not, a bed with a ventilator as a bed capable of accepting a patient on ventilation if staffing was sufficient, and a bedside nurse as staffing availability sufficient for one level-3 or two level-2 beds according to Guidelines for the Provision of intensive Care Services (GPICS) standards.10 This was necessary rather than relying on commissioning data because, for example, ‘eight level-2 beds, eight level-3 beds’ could describe a unit with only eight ventilators, or a unit with a flexible model that could close level-2 beds to accommodate up to 12 patients on ventilation with the same staffing numbers.
Resource position in 2019
For the future-population modelling aspect of our work, we used Office for National Statistics (ONS) estimates of the age structure of the Local Authority of each ICU in 10-year age bands.11 We resampled CCMDS data to model changes between 2029 and the index year 2019 in both the underlying frequency of demand for critical care admissions in each unit, and the complexity in cases associated with an ageing population. This was done by modifying the admission frequency of each unit according to changes in the predicted age-stratified local population, and by altering the relative frequency of patient data input to the bootstrap process, without altering any individual patient's data.
Model
The model was written in R 4.0.4 (R Core Team) and used the simmer12 library for event simulation. It was run for 18 simulated months per iteration, including periods of run-in and run-out to generate 12 months of usable data. Admission numbers were generated from a reverse binomial distribution, used in place of a more traditional Poisson distribution to allow for increased variation, in line with local analyses.13,14 This was indexed by admission type, time of year with a 28-day rolling window, and weekends and national holidays. For 2029 scenarios, this was also resampled as described above to represent predicted population changes. Generated admissions and their resource requirements were sampled from real data, again weighted where necessary to reflect population change. In runs of the model in which resource limitations were included, emergency admissions that could not be accommodated in the generating hospital were transferred to other hospitals in the network according to real-world preferences, or out of the network in the rare event of network capacity failure. Elective admissions for which capacity was unavailable were deferred for 1 week, except in the case of the hospitals hosting specialist services, where flexibility of beds and nursing staffing was permitted between units located on the same site, in line with real-world practice. In the event of short-term pressures, such as when a bed would become available later in the same day, the patient remained at the generating hospital (equivalent to the use of theatre recovery for flexibility) but the model recorded this as a sign of early pressure. A simplified overview of the model is given in Fig 1.
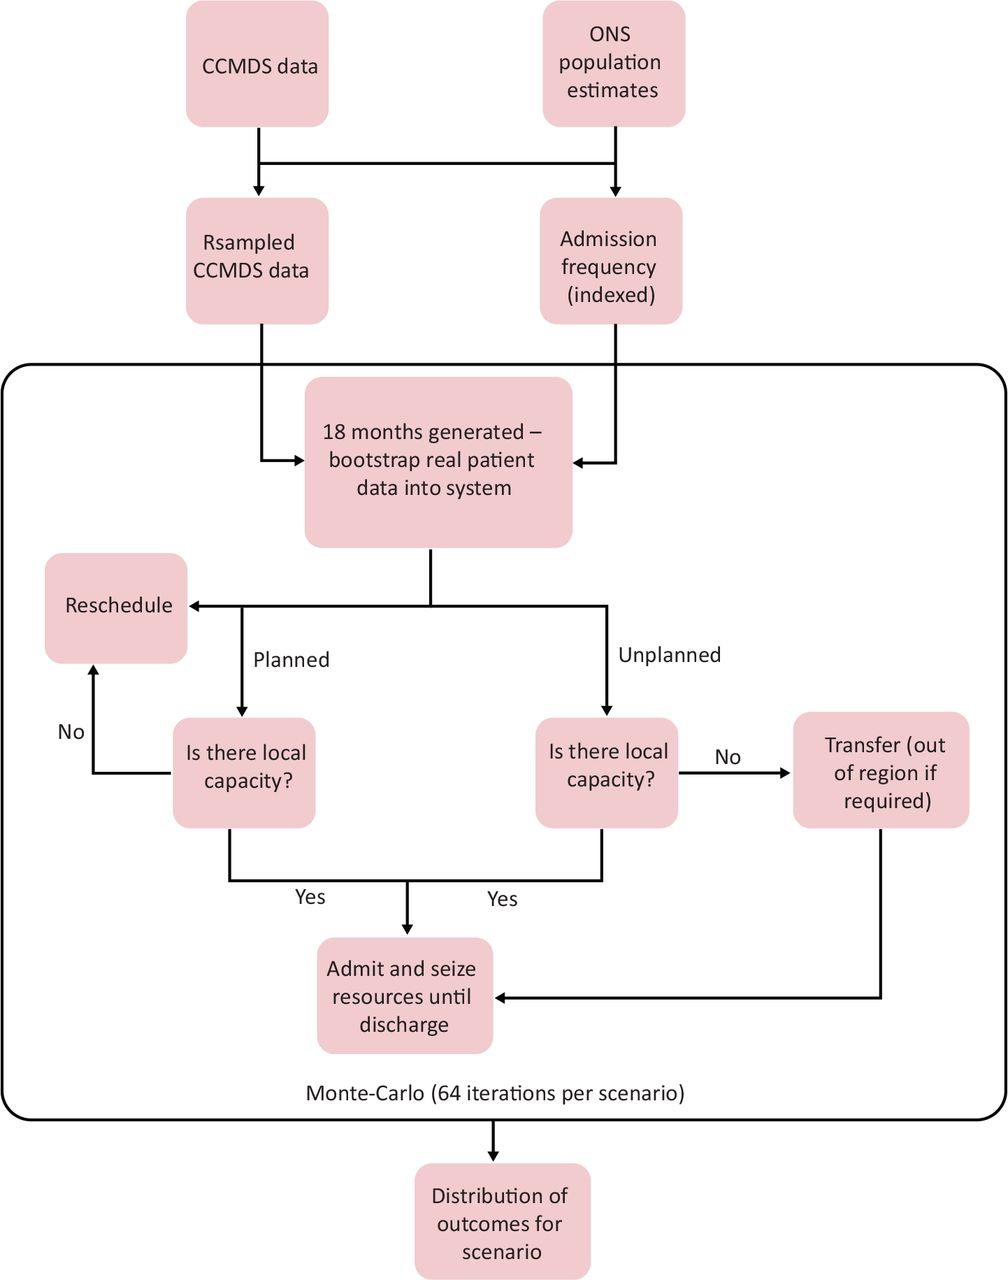
Simplified overview of model and data. CCMDS = Critical Care Minimum Dataset; ONS = Office for National Statistics.
To test each scenario, the model was run as a Monte-Carlo simulation for 64 iterations, sampling real-world values, such as occupancy and resource use, and 12-month totals for elective surgical cancellations, and non-clinical within-region and out-of-region transfers. Occupancy was calculated using the midnight census method,15 and as the maximum of nursing and physical bed use, to better represent situations in which flexibility results in a unit with physically empty beds but no capacity to take more patients. Given that the type of validation data varied by trust, the model was set up to allow relevant attributes to be generated for validation purposes, including unit occupancy, deferred elective surgery and non-clinical transfers to other units. Validation of the model was performed by running it with the baseline 2019 population and network resourcing, and comparing these model outputs with historical data collected from each unit and WYCCN audits.
Results
The resampled admission frequency predicted increases in raw numbers for all units from baseline to 2029, varying from 4% to 20% between units and patient admission types (Table 2). Outputs from an initial scenario run with 2029 parameters (modelling changes in both raw numbers and case complexity), and infinite resource availability are shown in Fig 2. From these, we estimated the resource availability required to satisfy demand 90%, 95% and 98% of the time; each of these was then tested as a scenario. Scenarios were created with the assumption that resource availability would not decrease where it was already in excess of predictions (eg Unit C's extra beds). Totals are shown in Table 3.
Modelled change in raw numbers for each unit from 2019 to 2029

Resource requirements with 2029 population showing 90%, 95% and 98% quantiles. L3 = level 3.
Total region resources (2029) for each tested scenario
In testing, network failure, defined by the need for non-clinical transfers out of the region, occurred in six out of 64 iterations in the 90% scenario, but not in the 95% or 98% scenarios. The 90% scenario also resulted in a median of 151 in-region non-clinical transfers per year, giving further evidence of a system under pressure. At the 95% and 98% levels, this figure was 63 and 16, respectively. Under sensitivity analysis, an increase in duration at each level of care by 5% beyond scenario values for all patients increased in-region non-clinical transfers to a median of 90.5 and 41.5 for the 95% and 98% scenarios, respectively, but still did not result in network failure. This occurred in one out of 64 iterations in the 95% scenario when this additional increase was set to 10%. Therefore, we continued with the 95% and 98% levels as recommendations, producing the recommendations in Table 4.
Recommendations for each unit using the 95% and 98% scenarios
These recommendations are equivalent to 8.5–9.3 beds per 100,000 total population in 2019 (8.2–8.9 per 100,000 in 2029), and are in agreement with modelling from NHS England suggesting a present requirement for 190 beds, rising as the population grows and ages (personal communication via email with K. Peters, Yorkshire and the Humber Specialised Commissioning, February 2022).
Discussion
We have demonstrated that a real-world data-driven modelling approach built using a novel bootstrapping method can allow a relatively complex, region-wide healthcare network to be simulated without relying on a more traditional probabilistic approach to patients or falling back to a simpler time-series model.16 We have previously argued that a probabilistic approach, such as Markov chain modelling, is problematic when it comes to the heterogeneity of patients in ICUs; our method avoids this issue by sampling real data directly. By simulating at the individual patient level, it allows the assessment of outcomes and recommendations at a local level, taking into account resource distribution around the region. In addition, it can model markers of network stress, such as non-clinical transfers, and even early indicators, such as same-day bed reuse. This informs regional network-level coordination while simultaneously providing strategic information for individual units and hospitals. It is clear from our experience that individuals embedded within units, with knowledge of how they function, are essential. We see the need for working with front-line staff as an advantage to the process.
The model relies on several underlying assumptions, which could limit its use. Many limitations are illustrated well by the COVID-19 pandemic. The bootstrapping technique models individual patients using resource requirements from historical data and, thus, does not adequately model novel diseases and situations. Clinicians' admission thresholds are known to vary with unit occupancy;17 however, our model treats all patients the same and we would argue that, for resource planning, this might be preferable. The random process for patient introduction is independent between units, except in its use of weekdays and the time of year as covariates, meaning that very rare (so-called ‘black swan’) events affecting all units together are not modelled. We debated adding COVID-19 specifically into the model, but there are no reliable estimates for its effects on ICUs in 10 years, and even now NHS ICU occupancy is an order of magnitude lower than the peaks of the first waves.18 The flexibility that coexisting level 2 and level 3 work provides to an individual unit is inherent in our model; however, this can be lost if future expansion separates these work-streams into geographically distinct units.
These limitations relate to the underlying modelling method we have developed, which has advantages and disadvantages because of its use of data from real patients without attempting to reduce the dataset to model parameters. Parameters make model assumptions more explicit, and can be used more easily to model counterfactual scenarios, such as a change in complexity leading to longer patient stays. However, we have demonstrated that this is feasible using our method by using resampling techniques to model a 2029 population scenario, and by modifying data for the sensitivity analysis of longer patient stays. Its real benefit comes from being able to model as heterogeneous a population as a patients in the ICU of a region without oversimplification or requiring a huge number of categories, and it has been successfully scaled to model the inpatient side of an entire NHS hospital.19 It also requires relatively little analysis to build the model, being largely driven by data, although decision-making processes must be explicitly coded and interviews with decision makers are usually required to enable this. In contrast to more numerical model types, such as system dynamic modelling, because this method effectively replicates the running of a simplified healthcare system, it can be queried to extract any variables of interest so long as they are supported by the underlying data. This was very useful when it came to variations in the data available to support validation, because we were able to add markers to the model to replicate the collection of real-world data that were available to us.
Our method can be practically applied to other regions, and we have started this work already; with some minor modifications, it could be used nationally. Incorporating quaternary services and a hierarchy of inter-regional transfers at times of network stress, which would include understanding local real-world resource use, would be an interesting challenge.
Acknowledgements
The authors would like to thank Jane Hudson for project coordination and collating data, and the West Yorkshire Critical Care data clerks for providing CCMDS reports.
- © Royal College of Physicians 2023. All rights reserved.


Jump to section
Related Articles
Cited By...
- No citing articles found.