
ABSTRACT
Background Behavioural insights or ‘nudge’ theory suggests that non-directional interventions may be used to modify human behaviour. We have tested the hypothesis that the provision of the cost of common blood tests with their results may modify subsequent demand for blood assays.
Methods The study design was a prospective controlled intervention study. The individual and annual institutional cost of full blood count (FBC), urea and electrolytes (U&E) and liver function test (LFT) blood assays were added to the electronic results system for inpatients at the intervention teaching hospital, but not the control hospital.
Results In the 12 months after the intervention was implemented, demand for FBC dropped by 3% (95% confidence interval (CI) 1–5; p<0.001), U&E by 2% (95% CI 0–4; p=0.054) and there was no change in demand for LFT compared to the control institution.
Conclusions Providing cost feedback to clinicians for commonly used blood tests is a viable intervention that is associated with small reductions in demand for some, but not all blood assays. As this is an easily scalable approach, this has potential to enable efficient healthcare delivery, while also minimising the morbidity experienced by the patient.
Introduction
Global demand for medical services continues to increase relentlessly, and can be expected to continue to do so as a consequence of a population which is living longer with chronic diseases. In the UK, there is a disparity between the predicted costs of healthcare and the resources available to service them.1 This has led to the need for consideration of new ways of delivering healthcare that can use existing limited resources more efficiently.
There are a number of relatively untouched approaches to delivering health efficiencies that are based in behavioural insight thinking, particularly with regard to high volume, low cost clinical activities. Behavioural insight theory suggests that awareness of patterns of behaviour can be utilised to design interventions that enable doctors to make more informed decisions. This approach is a light touch with no element of obligation for those who are happy with their current practice. One specific example of a ‘nudge’ intervention would be the provision of extra information to clinicians, not with the intention of directing the clinician in decision making and thus potentially reducing their autonomy, but by informing them of the cost of this decision.2 This may help reduce the substantial variation that exists between clinicians in managing medical diseases.3
This approach was initially demonstrated to be effective in promoting health cost savings in the USA in 1990. When the financial cost of diagnostic tests were displayed to the consulting physician, there was a cost saving of 13% in the outpatient setting as a result of reduced demand for tests.4 Subsequently, a study in the UK that used an intervention of labelling the results of a blood test, C-reactive protein (CRP), with the cost of the assay reported a 32% decrease in demand compared to the previous year.5 Similarly, making the cost of medication available to prescribing doctors resulted in an increase in selection of more economical antibiotic options.6
We tested the hypothesis that adding the cost of three commonly used blood tests, full blood count (FBC), urea and electrolytes (U&E) and liver function tests (LFTs) would modify demand in a prospective controlled intervention study based in a busy teaching hospital in the UK.
Methods
Study design
We used a controlled interrupted time series design. Interrupted time series analysis involves a before-after intervention comparison within a single population. However, the basic interrupted time series design cannot exclude confounding due to co-interventions or other events occurring around the time of the intervention. In this study, that might include temporal changes in healthcare and other factors that lead to change in demand for blood tests. One approach to minimise potential confounding from such simultaneous events is to add a control series so that there is both a before–after comparison and an intervention-control group comparison. The control should be as similar as possible to the intervention series, and should be exposed to the same co-interventions or events that might also affect the intervention series. The main advantage of this approach is that it can help to control for factors which may have changed the outcome and which were concurrent with the intervention.7
Study population
The setting was Royal Derby Hospital, UK (RDH), with Nottingham University Hospitals, UK (NUH) as a control hospital being the nearest large hospital serving a similar population. The RDH is a busy acute teaching hospital that has 1,100 beds and provides a broad range of specialist medical services.8 The NUH is also a busy acute teaching hospital that has approximately 1,700 beds and also provides many specialist services to the local population.9 It is the closest comparable hospital to RDH that serves a similar population in terms of socio-economic status and ethnicity. The study was an evaluation of a health service modification and no ethical approval was required.
Intervention
The intervention was added to all FBC, U&E and LFT on the 01 February 2017 for all hospital inpatients. It comprised the addition of a simple message below to the electronic blood test reports that was observed by requesting clinicians on the hospital reporting system. It was designed to highlight the cost of an individual blood test and the annual expenditure for each test by RDH, as this template has been effective previously.5 The intervention consisted of a short message that was visible when accessing the blood reports (eg ‘U&E cost 3.65 GBP & in 2014 RDH spent 362k GBP on U&Es’) with more information available by clicking to obtain an expanded result box (eg ‘U&E cost 3.65 GBP & in 2014 RDH spent 362k GBP on U&Es. All U&E costs 2.15 GBP excluding venesection. Each venesection costs 1.50 GBP’); an example of this can be seen in Fig 1.

Sample of short and expanded cost feedback electronic report. GBP = British pound sterling; RDH = Royal Derby Hospital.

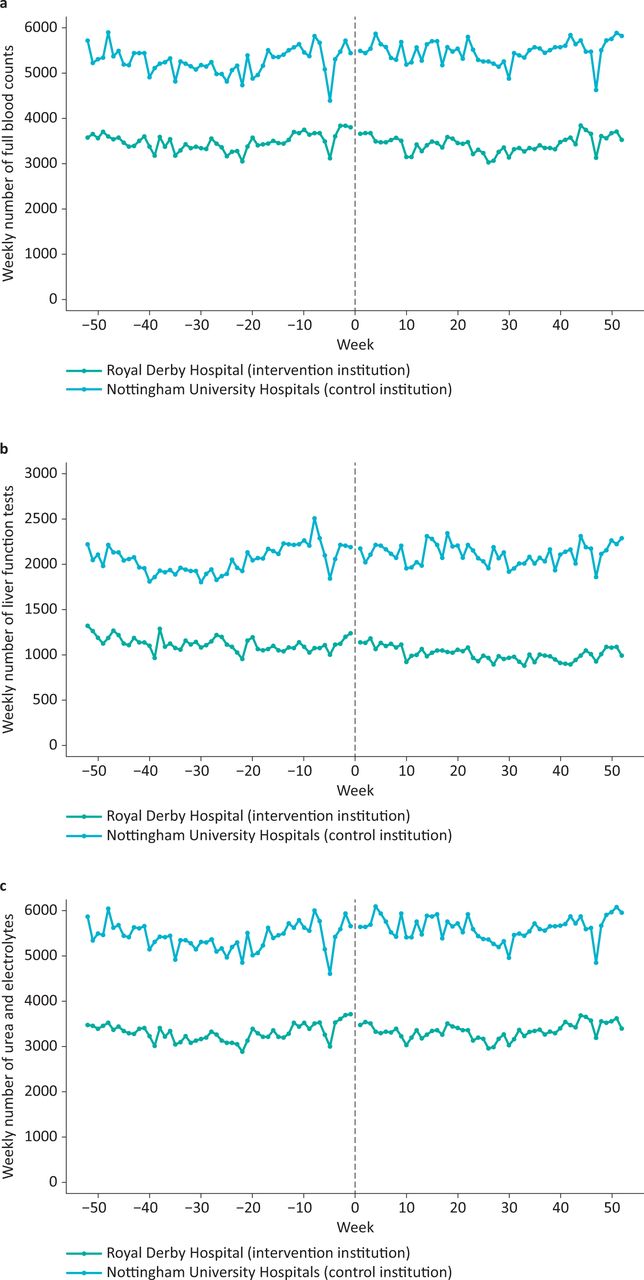
Weekly counts of a) full blood count, b) liver function tests and c) urea and electrolytes for Royal Derby Hospital (intervention institution) and Nottingham University Hospitals (control institution), before and after the intervention.
Outcome measures
The weekly number of FBC, U&E, and LFT assays performed in hospital inpatients collected for 52 weeks before the intervention compared with the 52 weeks after the intervention.
Statistical analysis
Segmented regression was used for the interrupted time series analysis, using a generalised linear model and assuming a negative binomial error distribution, appropriate to count data with ‘overdispersion’ where there is greater variability in the data than that normally expected in count data. We initially fitted a full model for a controlled interrupted time series, with terms for the pre-intervention trend (to allow for any underlying baseline trend in rates of blood tests), baseline difference between hospitals (to allow for a difference in mean blood test rates between hospitals at baseline), difference in the pre-intervention trend between hospitals (to allow for any difference in the underlying trend between hospitals), change in level for NUH (to allow for any change in blood test rates in the control hospital post intervention due to confounding factors), change in trend for NUH (to allow for any change in trend post intervention in the control hospital due to confounding factors), difference in the post-intervention change in level between RDH and NUH (our measure of the effect of the intervention on the mean rates of blood tests in the intervention hospital compared to any change in the control hospital), and difference in the post-intervention change in trend between RDH and NUH (our measure of the effect of the intervention on the trend in blood test rates in the intervention hospital compared to the control hospital).
Parsimonious models were identified by backward elimination removing those terms which were not significant at the 5% level. After examining model fit and autocorrelation, additional terms were added to allow for a winter increase (November to February), a specific Christmas effect (a sharp reduction was seen in Christmas week each year), and autoregression of order 1. Analysis was conducted using R statistical software using the tsglm function.
Results
Full blood counts
Baseline weekly counts of FBCs were higher in NUH than RDH, but the underlying trends were comparable. The results of the segmented regression analysis are shown in Table 1. After the intervention was implemented, the rate ratio for the change in level of the number of blood counts in the intervention hospital compared to the control hospital was 0.97 (95% confidence intervals (CI) 0.95, 0.99), or to put it alternatively demand for FBC dropped by an estimated 3% (95% CI 1–5) after the intervention.
Change in demand for blood counts at Royal Derby Hospital (intervention institution) compared to Nottingham University Hospitals (control institution) after the informational feedback intervention was implemented. A dummy variable for winter months and for the Christmas week was also included in the model. Only statistically significant variables are included in the parsimonious models.
Liver function tests
Baseline counts of LFTs were higher in NUH than RDH. The results of the segmented regression analysis (Table 1) showed there were 27% fewer LFTs undertaken in RDH than NUH in the pre-intervention period. There was no statistically significant change in the level or trend for numbers of LFTs in RDH compared to NUH following the intervention.
Urea and electrolytes
Baseline counts of U&Es were higher in RDH than NUH, but the underlying baseline trends were comparable. From the segmented regression model, there were 35% fewer U&Es carried out in RDH than NUH pre-intervention, with no underlying time trend in either hospital, but with a significant 3% increase in U&Es in the period post intervention in NUH. However, there was a reduction in level of U&Es in RDH compared to NUH post intervention of 2.0% (95% CI 0–4) that was of borderline statistical significance (p=0.054).
Discussion
This is the first prospective controlled study to test the hypothesis that provision of feedback to clinicians of the cost of routinely used blood tests modifies demand. This resulted in a 3% decrease in demand for FBCs, a 2% decrease in demand for U&Es of borderline significance and no change in the demand for LFTs.
The strengths of these data are that a simple hypothesis was tested using routinely collected data collated from the medical institutions’ information technology systems so that measurement error is very unlikely. The use of a control group is important, as this allowed adjustment for the underlying trends of annual increases in demand for healthcare that is normal in the UK.1 The implementation of the intervention was very simple, and took less than a day's work to initiate, suggesting that this approach is likely to be potentially viable for institutions with comparable electronic report information technology systems. The intervention was structured so that it was impossible to see the electronic result of the assays of interest without observing the cost-feedback information as well (Fig 1). Hence, we can be confident that the attending healthcare professional who was retrieving the individual results of the assays would have seen the cost feedback message at this time, although anyone reviewing the temporal trends of results or receiving results via an intermediary would not be exposed to the cost feedback. While a randomised controlled trial at the individual clinician level would have been the optimal study design, we were only able to test the hypothesis of interest at the institutional level as there is an inevitable collective learning experience as clinicians work and rotate through different teams as part of the modern patterns of healthcare delivery. We were unable to access data on repeated blood tests on a single hospital admission, and hence were unable to determine if the intervention impacted on decision making in this category of patients.
The selection of control hospital is important for the rigour of the study design and critical appraisal of these data. The intervention was planned for RDH as this was the lead institution where links with management and clinicians made the intervention deliverable. NUH was selected as the control institution as it was the largest comparable hospital that served a similar population in socio-economic and ethnic terms as RDH. It is not identical and is larger than NUH with 1,700 beds compared to 1,100 beds, and also provides some tertiary services such as the regional trauma service. However, using a control hospital in interrupted time series allows adjustment for other factors which may have led to changes in demand for blood tests after the intervention was introduced, and this was the best available option in a pragmatic study design.7 This study design is susceptible to confounding if there is a substantial change in the orientation of clinical services in one institution compared to the other over the study period. However, the authors collectively work in both institutions and are unaware of any such changes.
The decrease of demand of 3% for FBCs is encouraging as it suggests that clinicians observed our cost feedback intervention and that it modified their use of a simple blood test that is commonly used. The decrease in demand of U&Es by 2% is of borderline statistical significance (p=0.054), and thus could be a chance observation. However, there was no change in demand for LFTs at all.
Understanding these data requires some awareness of the context of the UK healthcare system where the study was delivered, the NHS is a taxpayer funded organisation which is free at the point of access. The blood tests are requested by a range of clinicians and healthcare professionals, and many will be not discretionary as they are protocol driven or required at the point of emergency admission. Personal observation suggests that ‘unnecessary’ or ‘optional’ blood tests occur in hospital inpatients, where practice varies between clinicians. The ‘nudge’ educational intervention is attractive in that it can reach all requesting clinicians efficiently and provide them with cost (or other types) information, but like other public health messages, it is susceptible to ‘message fatigue’ over time.10 It is possible that as the blood tests in this study are relatively cheap, cost is not a big factor in the decision to take blood or not, and that another form of ‘cost’ such as the discomfort of venepuncture may change clinicians’ use of diagnostic tests. We have recently demonstrated that adding the potential ‘cost’ of computed tomography (CT) to the CT report is associated with a 4.6% decrease in demand over 12 months,11 and this passive educational approach of potential adverse consequences of the test of interest may also have traction for blood tests.
This work was initiated as a consequence of an earlier study that demonstrated a 32% decrease in weekly demand for CRP,5 and consideration of these results collectively may explain the differential changes in clinicians’ use of these blood tests when provided with their costs. The CRP blood test is a measure of systemic inflammation and our experience is that some clinicians use it extensively to consolidate and support decision making in addition to the clinical changes in the patient. Others do not use it at all, but prefer to use a more clinically based approach. Hence, there was likely to have been a wide range of clinical use of this test, and thus a cost-based intervention may have had more traction with the more discretionary spectrum of CRP assays that some of the more parsimonious clinicians may not have requested anyway. FBC and U&Es are very commonly used in inpatients, and have a key role in both initially assessing patients, as well as ensuring that underlying physiological systems are either improving, or alternatively not deteriorating as a consequence of medical treatments (eg renal impairment with angiotensin converting enzymes or diuretics). We speculate that there is probably less variance in clinicians’ use of these tests, and hence less scope for clinical change as patient care and safety is paramount. Finally, LFTs are often only requested once on admission to hospital or more regularly in the context of liver disease, and as a consequence this is an assay that has little discretionary use, and hence no scope for decreasing demand.
In summary, these data demonstrate that addition of cost feedback to clinicians is associated with a 3% decrease in demand for FBCs, a possible 2% decrease in demand for U&Es and no change in demand for LFTs. These decreases in demand are undoubtedly small, suggesting that clinicians’ use of these common blood tests has little scope for large reductions by the intervention of providing the price to the requesting healthcare professional, and that other educational or more targeted approaches may be worth evaluation. However, this is a strategy that warrants consideration as it is cheap and simple to implement, and a 3% decrease in demand at the RDH for FBCs in inpatients would be associated with an annual decrease of 5,420 tests and an annual cost saving of £17,560 based on 2016 numbers. More importantly, some of the anxiety and pain experienced by patients as a consequence of donating blood samples was avoided, improving the patients’ experience of receiving healthcare.
Funding
The project was supported by the Health Foundation Behavioural Insights Programme.
- © Royal College of Physicians 2019. All rights reserved.


Jump to section
Related Articles
Cited By...
- No citing articles found.