
ABSTRACT
Mechanical thrombectomy (MT) is a very effective, but highly time dependent, reperfusion technique in the management of acute ischaemic stroke caused by large artery occlusion. MT is provided by 24 neuroscience centres (NSCs) in the UK which receive patients directly (‘mothership’) and via transfer from district general hospitals (DGHs), the ‘drip and ship’ pathway. NSCs currently provide a within hours service but are working on service expansion to enable 24/7 availability. DGHs, too, will need to prepare for this service expansion to ensure good outcomes for their patients. We discuss options for service expansion in a DGH and regional stroke network in south-west England and use Sentinel Stroke National Audit Programme data and discrete event simulation to model and compare alternative workflow options to aid the planning process. We suggest that our modelled options could be considered by all NHS DGHs in their preparation for MT service expansion.
Background
Mechanical thrombectomy (MT) is a highly effective reperfusion technique in acute ischaemic strokes (AIS) caused by large artery occlusion (LAO) and has been shown to have a number needed to treat (NNT) of 2.7 in a meta-analysis of five randomised trials.1 It is endorsed by national stroke guidelines and is being commissioned by NHS England.2,3 There are workforce and logistical barriers to its universal implementation and it can only be carried out in 24 tertiary neuroscience centres (NSCs) in the UK.4 MT is a very time dependent procedure; for every 15 minutes saved, an estimated 39 patients per 1,000 treated have reduced disability at 3 months including 25 more who achieve functional independence.5 In contrast to intravenous (IV) thrombolysis which must be administered within 4.5 hours of onset, MT can be performed up to 6 hours from onset in most cases and up to 24 hours in selected cases.2 Most NSCs in the UK provide a within working hours service at present, but all are working on service expansion with a view to rolling out a 24/7 service within a few years. About 1% of strokes receive MT at present whereas it is estimated that about 10% of strokes in England are eligible for this treatment.6
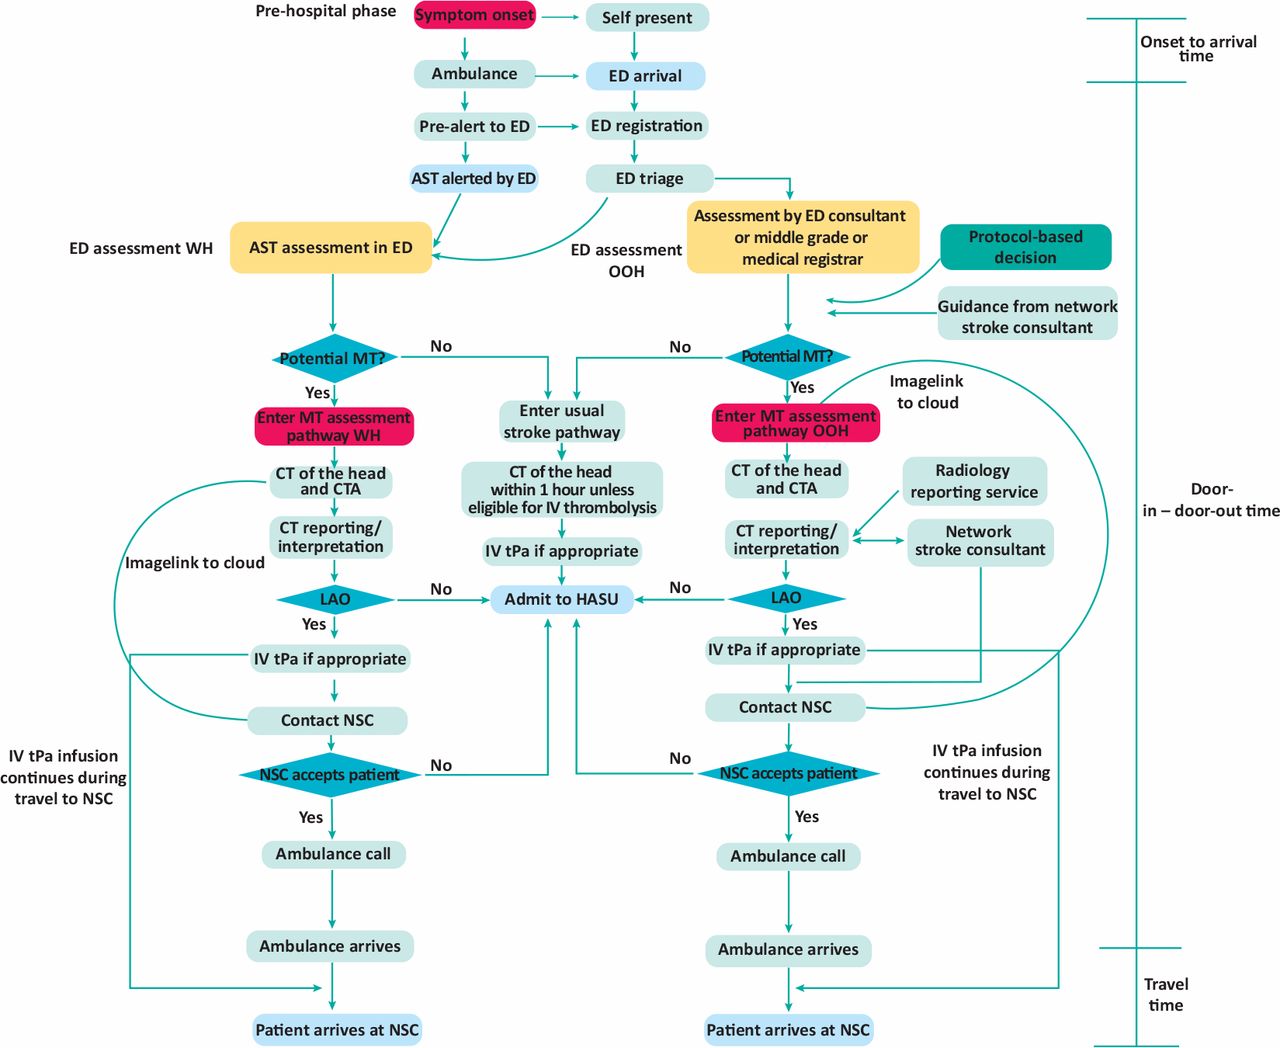
In some parts of the country, patients present directly to an NSC (the ‘mothership’ model) resulting in optimal treatment times but in other regions patients present to district general hospitals (DGHs) and have to be assessed locally, started on IV thrombolysis (if suitable) and transported to the NSC for MT (the ‘drip and ship’ model).7 The drip and ship procedure involves an urgent clinical assessment by stroke trained clinicians including assessment of severity by the National Institutes of Health Stroke Scale (NIHSS) and pre-stroke functional status by the modified Rankin Scale (mRS).8,9 Urgent vascular imaging is needed, typically plain computed tomography (CT) and CT angiography (CTA) to confirm LAO prior to consideration of thrombectomy. An early ischaemic stroke score, Alberta Stroke Programme Early CT Score (ASPECTS), ascertainment and assessment of the collateral circulation are also carried out.10 Some centres also use advanced imaging (CT perfusion or magnetic resonance imaging) to identify patients suitable for MT among patients who have presented late, have an unknown time of onset or are wake-up strokes.11 At present, assessment for MT is only possible within hours when the stroke team are present on site and there is full radiology support. With expansion of MT services in NSCs, DGHs too will have to prepare for this service expansion; a larger number of AIS patients will have to have enhanced assessments 24/7 and have tests (CTA and advanced imaging) that are currently not routinely performed out of hours (OOH). These scans will have to be interpreted and reported formally and arrangements will have to be made for 24/7 referral pathways and urgent transfer to the NSC. Many DGHs typically have workforce issues and hard-pressed radiology services. To improve patient outcomes, DGH MT pathways must operate as efficiently as possible and variability in turnaround times kept to a minimum. Fig 1 shows MT pathways within hours and OOH.

Emergency department mechanical thrombectomy assessment pathway for drip and ship centres. AST = acute stroke team; CT = computed tomography; CTA = computed tomography angiography; ED = emergency department; IV = intravenous; HASU = hyper-acute stroke unit; MT = mechanical thrombectomy; NSC = neuroscience centre; OOH = out of hours; tPa = tissue plasminogen activator; WH = within hours.
We studied expected patient numbers and times of arrival, and explored workflows for MT assessment in a typical DGH within a regional stroke network in south-west England. We show how discrete event simulation (DES) can be used to model the MT assessment pathway, particularly to simulate OOH pathways that do not exist at present, and test pathway optimisation options.
Methods
Setting
The Avon, Gloucestershire, Wiltshire and Somerset (AGWS) stroke network was created in 2008 to implement shared IV thrombolysis protocols, teleradiology and a remote thrombolysis service which enabled 24/7 thrombolysis in this region in 2011.12 It covers the counties of Avon (including Bristol), Gloucestershire, Wiltshire and Somerset, serving approximately 2.25 million people. It includes rural and urban communities and includes eight DGHs and the NSC (North Bristol trust) and one ambulance service. All the DGHs have stroke units and stroke specialists who provide thrombolysis, one providing a 24/7 in-house service. Seven other hospitals participate in a remote thrombolysis rota using teleradiology and telephone advice for OOH thrombolysis.12 Patient arrival patterns and other inputs for the simulations were derived from Gloucestershire Royal Hospital (GRH) which has a catchment population of 580,000.
Sentinel Stroke National Audit Programme data extraction
Anonymised data were extracted from the Sentinel Stroke National Audit Programme (SSNAP) dataset for GRH for 1 year to provide inputs for the simulation.13 This prospectively entered audit programme collects a minimum stroke dataset in England, Wales and Northern Ireland.13 Times of onset and arrival, onset during sleep, demographic details, stroke phenotype, admission NIHSS scores and pre-stroke mRS scores were extracted. Patients needing MT assessment were derived from standard criteria (NIHSS ≥6; mRS ≤2; see supplementary material S1 Table S1).2 Number of strokes in 1 year were also obtained for the other network hospitals from SSNAP data and the proportion of potential MT referrals from these centres was estimated using the 10% figure suggested in previous work.6 The study was reviewed by the Research Design Service South West and exempted from formal ethics approval and classed as a service improvement project.
Local thrombectomy assessment audit
A local thrombectomy assessment audit was conducted to obtain other inputs for the simulation; data collected included time from the acute stroke team (AST) call to arrival, assessment time by the AST, time taken in performing the CT and CTA, reporting time, time taken to contact the NSC, NSC acceptance time, time from call to ambulance arrival and travel time to the NSC; these steps are shown in Fig 1. Travel times to the NSC were modelled using Google Maps with variation dependent on time of day or day of week. ASPECTS scores were calculated by one observer on patients meeting criteria for MT assessment.
Discrete event simulation
DES is a method of simulating the behaviour and performance of a real-life process or system.14 Simulated patients can be generated at arrival rates determined from previous observations and can travel through the simulated pathway to provide insights into its effectiveness. A wide range of practical applications such as optimising patient flows or predicting the performance of a new protocol are possible by this method.14 For the purpose of this study, patients presenting within 6 hours of onset were considered eligible for MT as many centres in the network do not yet have access to advanced imaging to select patients who present late. ASPECTS scores were not used in patient selection; however, variation in process times, patient arrival rates and other factors within and OOH were incorporated into the model through probability distributions derived from the data sources already discussed (see supplementary material S1 Table S2 for further details). Ten simulations (each comprising >800 patients admitted over 1 year) were run for each model and pooled results obtained. A one-way sensitivity analysis was conducted to assess the impact that changes (increase or decrease of 20%) in certain parameters might have on the model’s conclusions.
Service options modelled by DES
Three models were tested for efficacy, shown in Table 1. Model A represents the status quo and model B incorporates some possible improvements in CTA reporting and contacting the NSC. Model C has further refinements in stroke team working hours and ambulance call times and incorporates the changes made in model B. These options were derived from service review meetings within our stroke and radiology departments.
Characteristics of the three models tested
Main outcome measures
Workflow times in the DGH MT assessment pathway; time from first arrival at the DGH to time of departure ie the door-in – door-out (DIDO) time, travel time to the NSC and total time from stroke onset to arrival (OAT) at the NSC (OAT + DIDO + travel time). A constant NSC arrival to arterial puncture time of 45 minutes was assumed (based on previous workflow analysis) to calculate onset to arterial puncture time in order to estimate outcomes (mRS 0–2) at 3 months.16
Software and statistical analysis
Data were processed and analysed using MS Excel and ‘R’.17 The R DES package ‘Simmer’ was used for the simulations.18 A one-way sensitivity analysis and tornado plots were obtained to assess the impact of a fixed change in key parameters on the DIDO time within hours and OOH. Probability distributions of model time inputs were obtained by plotting histograms, obtaining skewness-kurtosis plots and maximum likelihood estimates. The Anderson–Darling goodness of fit statistic was used to select the best distribution. Bootstrapping (sampling with replacement) was used to reduce the uncertainty around population parameters to compensate for small numbers in the audit. A one-way analysis of variance design using the non-parametric equivalent test (Kruskal–Wallis) was used to compare outputs of competing models which were derived from 10 replications of each simulation representing >800 simulated thrombectomy pathway patients. The probability of an outcome of mRS 0–2 (functional independence) at 3 months for treated patients as a function of onset to arterial puncture time was estimated from the meta-regression graph of Saver et al.5
Results
From 01 March 2017 to 01 March 2018, there were 871 strokes admitted to GRH. Inpatient strokes (48) were excluded, leaving 823 patients whose data were analysed. Wake-up strokes numbered 144 and 393 had an unknown time of onset. Mean age was 76.7 years (standard deviation (SD) 13.2) and 53% were males. Of all strokes, 726/823 (88.2%) were infarcts and median admission NIHSS was 4 (interquartile range (IQR) 2–10).
The median NIHSS of patients suitable for MT assessment was 12 (IQR 9–17). Patients presenting to hospital within 6 hours of onset numbered 306/823 (37.2%), and 377/823 (45.8%) presented within 12 hours. Median stroke onset to arrival times for patients who presented within 6 hours was 91.8 minutes (IQR 67.8–121.8) between 8am to 8pm and 108 minutes (IQR 76.5–168.6) between 8pm to 8am. Of patients presenting within 6 hours, 112/823 (13.6%) were suitable for assessment for MT based on predefined criteria and 123/823 (14.9%) presenting within 12 hours would need MT assessment. ASPECTS scores done on a separate audit sample suitable for MT assessment within 6 hours of onset showed that only 6/100 patients had an ASPECTS score <6 (the cut off for MT selection). The ASPECTS score was therefore not included in the MT assessment criteria for this study.
Supplementary material S1 Fig S1 shows the arrival times of all stroke patients and those appropriate for MT assessment for presentations within 6 hours of onset.
Table 2 shows the actual number of patients admitted within hours (defined as 8am to 5pm and extended to 8am to 8pm) and OOH (defined as 5pm to 8am or 8pm to 8am) while supplementary material S1 Table S3 shows that 474 patients per year are likely to be suitable for MT from all hospitals in the AGWS network. These represent 10% of all stroke patients and the within hours and OOH split is extrapolated from the data from GRH.
Numbers of patients arriving at different time periods and eligible for mechanical thrombectomy assessments
Results of simulations
Table 3 compares real and simulated patient data for the three models. Simulated and actual data showed a very good match providing evidence for the validity of the models. Table 4 shows the various simulated workflow times for individual components of the three models’ pathways.
Model validation – actual and simulated patient numbers and characteristics
Simulated workflow times for individual components of each model’s pathway
Our sensitivity analysis shows the effect of a 20% increase or decrease in several key inputs on the DIDO time both within hours and OOH. The tornado plots (supplementary material S1 Figs S2 and S3) show that the ambulance arrival time and CTA time were the most influential factors influencing the DIDO time both within and OOH, but waiting time for doctor and CTA decision time were also important OOH.
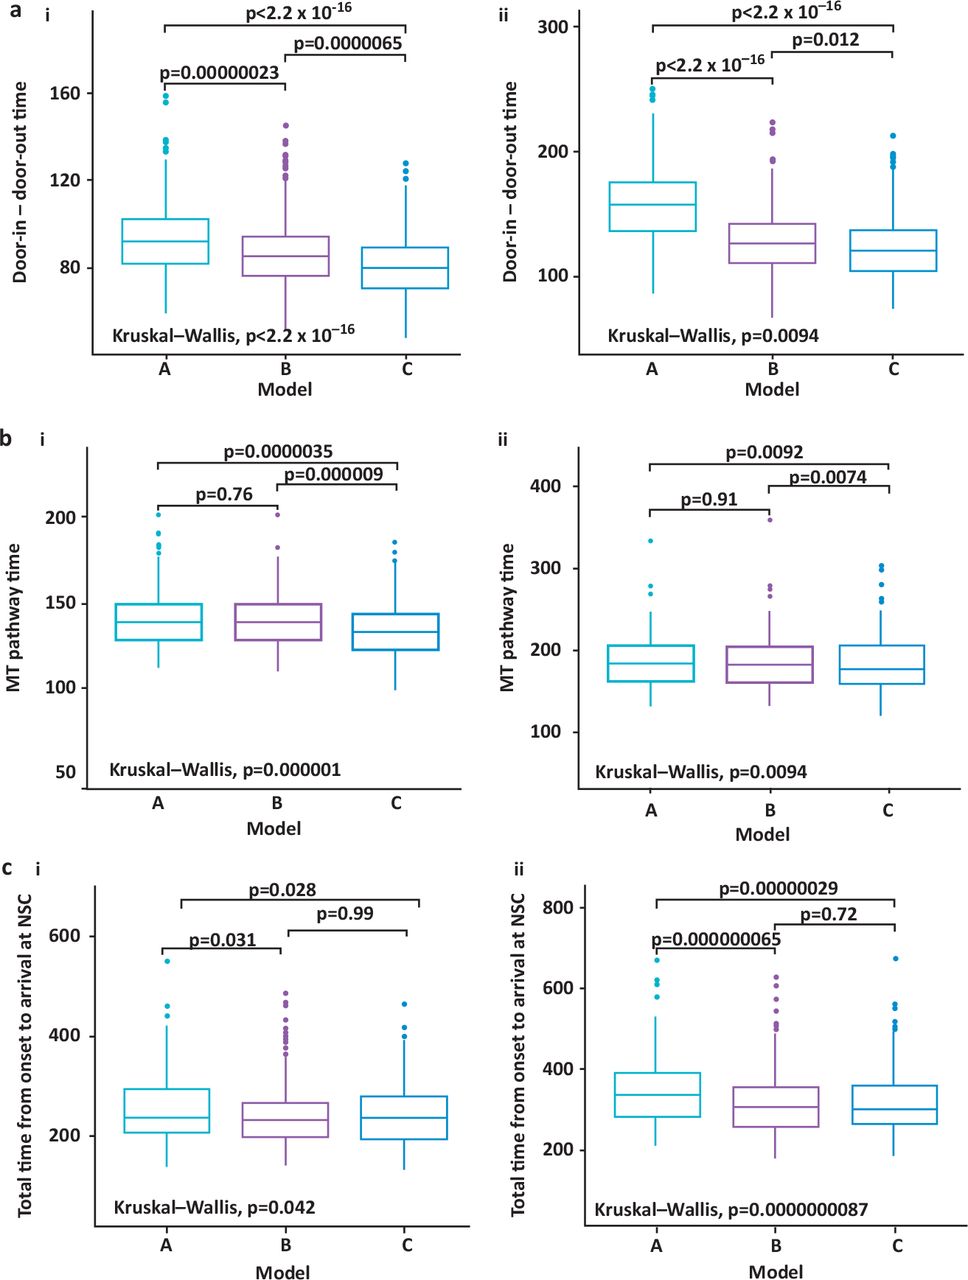
The simulated DIDO, total pathway times from arrival (DIDO + travel times) and total time from stroke onset to arrival at the NSC were compared for the three competing models and tested for statistical significance. The results are shown in Fig 2. Median DIDO times in minutes within hours were for model A 90.7 (IQR 81.1–101.5), model B 85.2 (IQR 76.4–95.3) and model C 79.4 (IQR 70.7–89). Corresponding median times OOH were model A 152.9 (IQR 134–173.3), model B 125.6 (IQR 109.9–143.4) and 120.5 (IQR 104.8–137.7). Model C showed a statistically significant difference in its favour in all three comparisons made with model A and in two of the comparisons with model B.

Comparison of simulated pathway times. a) Door-in – door-out time (in minutes) i) within and ii) out of hours. b) Total mechanical thrombectomy pathway time (door-in – door-out + travel time) i) within and ii) out of hours. c) Total time from onset to arrival at neuroscience centre (onset to arrival + door-in – door-out + travel time) i) within and ii) out of hours. MT = mechanical thrombectomy; NSC = neuroscience centre.
Assuming a constant median NSC arrival to arterial puncture time of 45 minutes, the median onset to arterial puncture times in minutes for the three simulations would be for model A within hours 284 minutes (IQR 249.3–327) and OOH 377 minutes (IQR 330–430.1), model B within hours 280 minutes (IQR 244.3–318.4) and OOH 356 minutes (IQR 310.1–415.9) and model C within hours 282 minutes (IQR 242.1–316.0) and OOH 346 minutes (IQR 308.5–412). As 65% of potential thrombectomy assessment patients would be seen within the extended working hours of model C (8am to 8pm) this would equate to approximately 53 patients per year having a median door to arterial puncture time of about 282 minutes. This would lead to the expectation that approximately 45% (24 patients) should have a mRS of 0–2 (functional independence) at 3 months based on the nomogram from Saver et al.5 Approximately 40% of 29 (12) patients sent to the NSC OOH via model C would be expected to have a 3 month mRS of 0–2 giving a total number of 36 patients with an estimated mRS of 0–2 at 3 months. The corresponding annual numbers with mRS 0–2 at 3 months for model B would be 35 (19 within hours and 16 OOH) and from model A 33(18 within hours and 15 OOH). For every 1,000 patients treated, 13 more patients would have functional independence with model C compared to model B and when compared to model A, 37 more patients treated via the model C pathway would be functionally independent.
Discussion
Our results suggest that about 13–15% of all strokes arriving at a typical DGH will need to enter the MT assessment pathway. Previous data suggest that 10% of all strokes are likely to have LAO and be eligible for MT.6 About 475 patients from the AGWS network are thus likely to need referral to our NSC every year once the system begins to work at full capacity. In our simulations, the optimum model was model C which included stroke specialist presence from 8am to 8pm, extending ambulance pre-alerts to this period, the interpretation of CTA by in-house stroke consultants and network wide telemedicine support for OOH CTA decisions and interpretation with a dedicated telephone hotline referral pathway to the NSC. Model C also assumed that the ambulance call category for transfers to the NSC would be category 2 (average response time of 18 minutes).15 Model C was likely to enable 65% of suitable patients to receive more rapid assessments and transfers for thrombectomy. The use of a dedicated mobile phone hotline for NSC referrals and enhancing CTA interpretation skills among local stroke physicians to bypass formal radiology reporting OOH had the potential to shorten the pathway by approximately 20 minutes. Model B shared many characteristics with model C and was the next best option.
Although extending working hours from 8am to 8pm is predicted to have an impact on reducing assessment times, the benefits of this change were reduced by the delay in stroke onset to arrival of about 19 minutes in patients arriving OOH compared to those arriving WH. Further public education campaigns will be needed to ensure a quicker response from patients and their families following stroke onset regardless of the time of day or night.
Onset to arterial puncture times for drip and ship patients in randomised controlled trials (RCTs) has been a median 295 minutes (IQR 255–342.5).5 Our simulations suggest a comparable median time of 282 minutes within hours but 346 to 377 minutes OOH. The overall onset to arterial puncture time in RCTs for direct and drip and ship patients has been 238 minutes (IQR 180–302).5 This suggests that as local pathways begin to embed, great efforts will need to be made to reduce process times to approximate those achievable in RCTs.
Our models have several limitations; the amount of data available for actual patients assessed and treated by MT is small and we had to use bootstrapping to reduce the uncertainty around certain sample parameters. Other inputs for the simulations, although derived from 1 year’s data, were adequate as our centre treats the largest number of strokes in our region. Our models are a relatively simple approximation of the MT assessment pathway and do not fully take into account extreme pressures on the ED, particularly OOH. However, the modelled waiting times for the doctor and doctor assessment time are derived from local audit data which take competing pressures and proportion of patients pre-alerted into account. Likewise, journey times to the NSC are based on estimates and we do not have any actual data on this. We have also assumed a constant 45-minute door to arterial puncture time based on previous workflow data from RCTs in order to estimate outcomes.16 The estimated proportion of patients achieving functional independence in our models will also need testing against real patient data. We have not yet implemented any of the processes modelled and we hope that these simulations will form the basis of future service expansion plans. The actual workflow times achieved in real life may not match the simulations but in such an eventuality, measures can be taken to improve efficiency. Several of the options, such as extending working hours for stroke specialists will require major changes in current working practice. Staffing shortfalls and costs associated with the implementation of each model have not been addressed in our simulations. These factors will clearly influence actual service development. In particular, the current shortfall in the number of stroke specialist consultants will make any expansion in stroke specialist presence OOH difficult. CTA interpretation by on-call stroke physicians will be dependent on ongoing CTA training and refresher courses to maintain competency. Major changes to current practice will also need to be implemented by hard pressed radiology services to ensure timely CTA OOH. Recent developments including artificial intelligence driven automated CT and CTA reporting software may influence future workflow options.
The models compared in our DES study, which is the first to model MT assessment pathways in DGHs, can act as a template for service development for all DGHs to ensure that a very time dependent treatment such as MT can be successfully set up via close cooperation between NSCs, the ambulance service and DGHs within a stroke network. We plan to audit and report on the final implementation of our MT assessment pathways following actual service expansion.
Conflicts of interests
Dipankar Dutta is the principal investigator of two Bayer sponsored clinical studies and a Boehringer Ingelheim sponsored atrial fibrillation registry. Dipankar Dutta, Mudhar Obaid and Gopinath Ramadurai have accepted conference sponsorship from Bayer, Boehringer Ingelheim and Daiichi–Sankyo.
Supplementary material
Additional supplementary material may be found in the online version of this article at www.rcpjournals.org:
S1 – Additional tables and figures.
- © Royal College of Physicians 2020. All rights reserved.
References


Jump to section
Related Articles
Cited By...
- No citing articles found.