
ABSTRACT
Hospital mortality rates have frequently been improved by identifying diagnostic groups with high mortality and targeting interventions to those specific groups. We found that high residual inpatient mortality persisted after targeted measures had achieved an initial reduction, and that the causes were spread across a wide range of diagnostic groups. Further interventions were put in place consisting of a structured electronic mortality form and systematised mortality scrutiny and reporting (primary intervention) accompanied by a number of quality improvement interventions arising from the mortality analysis (secondary interventions). We found that those interventions were associated with progressive improvements in mortality rates and average lengths of inpatient stay over the 5-year study period. Winter quarter mortality improvements reached a high level of statistical significance but could not be attributed to changes in any particular diagnostic groups. We conclude that progress with mortality improvements is probably best achieved by applying both code-targeted and general interventions simultaneously.
Introduction
Concerns over hospital mortality rates are not new, with qualitative descriptions reaching back to at least medieval times. Quantitative descriptions of hospital mortality first appeared in the mid-19th century when Florence Nightingale and William Farr used numerical data to describe the variations in mortality in a number of hospitals.1 Nightingale and Farr linked the high mortality among hospitalised soldiers to poor standards of hygiene, cleanliness, air quality and wound care.2,3 In effect, this was an early example of root cause analysis. Their work laid some of the foundations for current approaches to the reduction of hospital mortality, namely, measure death rates, identify the reasons, consider whether some deaths could and should have been avoided, change practice and measure any change in the rate. In advanced healthcare systems, a considerable amount of work has been done to understand and consequently minimise hospital mortality.4–7 In many cases the more easily identified specific causes have been ameliorated through targeted mortality reduction initiatives. This then leads to a more challenging need to reduce mortality across a wide range of diagnostic codes. In this paper, we describe the organisational response to apparently high unexpected mortality flagged for our acute hospital trust in 2013, including our interpretation of the data, the need to accept that our already considerable programme to improve clinical care was not complete, and the impact and significance of a multicomponent intervention to achieve even better mortality performance over the subsequent years.
Methods
Background: agreeing the need for a fresh approach
The trust described herein had enjoyed a mid-range position in mortality league tables for a number of years until 2011 when a high rate of unexpected deaths was found in certain code groups, including stroke care and oncology. A close case-by-case audit showed that the outlying position for mortality was explained to a corrective degree by the allocation of incorrect codes in a significant proportion of cases, inadequate documentation of end-of-life status for some patients, lack of clarity in the identification of patients expected to die and the presence of a hospice within the acute trust. However, in 2013 the trust was again found to have a hospital standardised mortality ratio (HSMR) in the most adverse quartile.6 Also, it was not possible to identify diagnostic groups that clearly accounted for the adverse index; it appeared that higher than average mortality across a range of high-volume codes contributed to the overall high HSMR. Of course, as would be expected, the largest proportion of contributing cases were from the medical directorate, comprising all acute medical specialties, including acute geriatric medicine. The admitted case mix was very broad and included a large proportion of patients of advanced age and/or with complex comorbidities, as well as those with severe monopathology illnesses. Clearly, it was no longer possible to take corrective action by targeting a small selection of diagnostic groups for in-depth cause analysis with a view to changing practice and allocating additional resources. A decision was therefore taken, with support from senior management, to continue to develop and modify services, particularly across the medical directorate, in the light of best-practice examples and the recommendations of expert bodies such as the Royal Colleges of Physicians, the Advancing Quality Alliance and relevant specialist medical societies.7–9 Further, it was decided that in addition to the mortality indices generated nationally, the trust would make full use of its in-house mortality and coding data to track any changes in mortality indices from all causes and in sub-groups selected by diagnostic code, age and sex.
Interventions to reduce mortality rates
The steps taken by the trust in an attempt to consistently and progressively reduce unexpected deaths can be described as primary and secondary interventions.
Primary intervention: development and deployment
There was a clear need to bring together the departmental morbidity and mortality (MM) activities that were occurring across the trust as has been advocated by other studies.10 These were highly variable in frequency, content, quality and effectiveness. To gain a better understanding, a scoping exercise was conducted in 2012. This consisted of members of the project team liaising with mortality lead clinicians; attending specialty, directorate and MM meetings; and gleaning information from the clinical governance and audit departments. After wide internal consultation and discussion, an acceptable way to address this unsatisfactory state was proposed. A structured pro forma for mortality reviews was developed, through several plan, do, study, act (PDSA) iterations until a version was agreed by representative clinicians as being fit for purpose. The pro forma was prepared for exclusively electronic use and dubbed the eMortality form. This went on to be piloted in three specialties (geriatric medicine, haematology and vascular surgery) to detect and correct any operational problems, of which there were very few, before a roll-out to all departments.
The primary intervention was therefore the introduction early in 2013 of a detailed eMortality data acquisition system across all directorates within the trust. All deaths were included and the senior doctor responsible for each patient was required, through an internal email flagging system, to provide detailed structured information and to confirm whether or not the death was potentially avoidable. All responses were expected to be based on the electronic patient record and other stored information, such as imaging and laboratory data. Narrative feedback was also recorded to provide guidance for any targeted change of practice that might be necessary. Information from these individual reviews was then expected to be taken into account at departmental or specialty MM meetings, which were required to take place at least quarterly. A further layer of scrutiny was provided in each individual case by nominated directorate mortality leads before an eMortality file was deemed to be complete and ready for collective discussion. In 2015 the process was arguably strengthened by having the initial review performed by a senior doctor other than the one responsible for the clinical care of the patient, usually from the same or a similar field of practice. The development of the eMortality form was iterative and in 2017 was modified further by taking into account the principles of structured judgement.9 Each directorate had a senior clinician nominated to ensure these actions took place, with overall scrutiny by the Trust Mortality Surveillance Group (TMSG).
Secondary interventions: identification and action plan
It became apparent from an early stage in the scrutiny of eMortality information arising from the primary intervention, coupled with a critical appraisal of reported adverse incidents and near misses, that certain recurrent issues contributed to the less-than-perfect care given to some patients, particularly in the first two days after admission to hospital. Information gleaned from the process was disseminated through a regular mortality newsletter to clinical staff.
Based on the findings of the primary intervention actions were taken, mainly in the latter 6 months of 2013, to address the issues identified. Some of these were new initiatives and some consisted of better implementation of existing interventions through local guideline revision, active promotion of good practice through departmental and trust educational events, celebration of improved practice in trust staff communication media and targeting weak areas that required additional resources to support improvements. Specific secondary interventions included:
the introduction of a unified electronic vital sign recording and early warning scoring system (Vital Pack®) across the trust supported by a rollout training programme
adopting and promoting the National Institute for Health and Care Excellence intravenous fluid guideline, reinforcing the guideline during medical and nursing training events and requiring all consultant medical staff to have annual fluid management training
generating and implementing a new acute kidney injury (AKI) management policy based on current best evidence and practice
active promotion of the trust's sepsis guideline through in-house media and in trust mandatory training.
a service shift that allowed senior doctors to be present in the hospital to review newly admitted patients and deteriorating patients outside ordinary working hours on weekdays and at weekends
a revised nursing template to maximise the presence and distribution of experienced nurses in acute areas of the hospital
introduction of daily ambulatory clinics in geriatric medicine and acute medicine to review selected patients soon after discharge, or by referral from the community
development of an electronic process for mortality reviews and dissemination of learning from deaths.
The main purpose of the study described in this paper was to explore the concordance and temporal relationship between the introduction of measures such as those described above and changes in a number of indicators including mortality and average length of stay (LOS) in hospital from 2012–2017.
Location
The study took place in a large acute NHS trust composed of two sites: Royal Bournemouth Hospital (RBH) which is a general acute hospital with around 500 beds receiving most specialties except paediatrics, major trauma and obstetrics; and Christchurch Hospital which provides mainly outpatient services but includes a 16-bed residential specialist palliative care unit (Macmillan unit (MU)) for patients with end-of-life conditions.
Data definitions and sources
Crude mortality rate (CMR) was defined as the number of inpatient deaths divided by the number of admissions. CMR data were extracted electronically for admissions to the RBH and the MU after filtering out emergency department (ED) attendances and day cases. All elective and non-elective admissions were included. The HSMR and summary hospital-level mortality indicator (SHMI) were extracted from national data sources.
LOS was defined as the average number of days in hospital for elective and non-elective admissions to the RBH and the MU where the LOS was more than 24 hours.
To illustrate the impact of various interventions, a time series was created to investigate the likely effect on inpatient CMR and LOS. Corresponding HSMR and SHMI values were also included in the analytic matrix to explore the correlation within adjusted and non-adjusted mortality indices.
Statistical method
Multiple correlations within the time series were studied and calculations were done to identify statistically significant differences in outcomes and to determine whether this could be attributed to any specific intervention. Analysis of variance (ANOVA; for single and double factors) was used to test for any significant correlation in CMRs for financial years from 2012/13 to 2016/17. Variance was also studied for quarterly indices to take account of variations in winter months. Each p value was adjusted for the number of groups being studied (Bonferroni correction). Any significant variation was compared by correlation to the intervention(s) within that time frame (Fig 1).
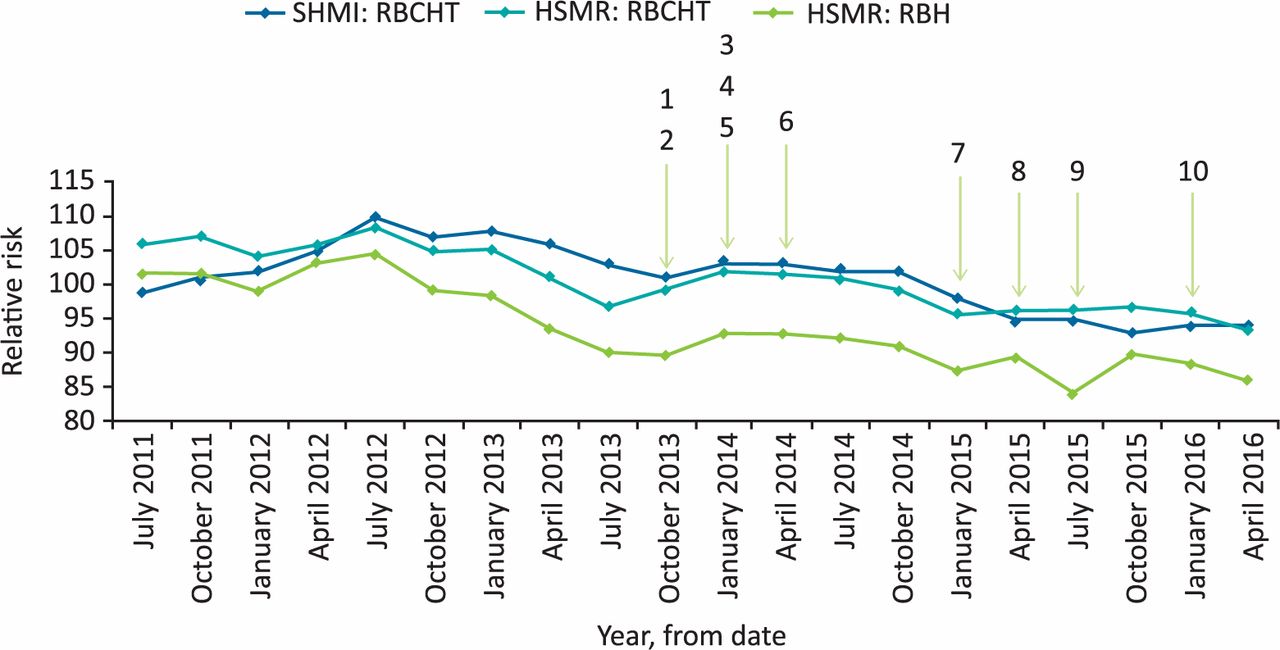
The timing of interventions and the changes in mortality indicators from 2011 to 2017. 1 = October 2013: trust-wide rollout of eMortality review. 2 = September 2014: sepsis collaborative to monitor and improve. 3 = January 2014: VitalPAC for recording vital signs electronically. 4 = March 2014: acute kidney injury guidelines enhanced consultants’ cover over the weekends. 5 = November 2014: ambulatory clinics in acute and geriatric medicine. 6 = March 2015: extended acute medical unit working into evenings. 7 = December 2015: intravenous fluid management. 8 = January 2016: quarterly publication of mortality newsletter. 9 = August 2015: culture change champions. 10 = December 2016: deteriorating patient collaborative. HSMR = hospital standardised mortality ratio; RBCHT = The Royal Bournemouth and Christchurch Hospitals NHS Foundation Trust for all admissions including the Macmillan unit; RBH = the Royal Bournemouth Hospital site only; SHMI = summary hospital-level mortality indicator.
Results
Results from the primary intervention
In a relatively short period, there was a sufficient volume of information to indicate that some potentially avoidable deaths could be attributed to less-than-ideal management of a number of relatively common conditions across a number of diagnostic groups including, but not confined to, sepsis, acute kidney injury and heart failure, with some particular concerns regarding inconsistencies in an important minority of cases with respect to intravenous fluid management, the prompt initiation of antibiotics and early senior specialist review. However, no simple pattern emerged and there was no indication of grossly inadequate or negligent practice. Though the majority of patients, including those who died, had received very good care there seemed to be a need for an all-round improvement in the quality of care to ensure that fewer patients would be at risk.
Association between the interventions and rates of mortality and LOS over time
We found that CMR, HSMR and SHMI all showed a declining trend over the 5-financial year study period (Fig 1). The improvement in the mortality rates did not reach statistical significance when compared across whole financial years (Table 1), either within the group or between the groups. However, when a similar ANOVA was applied to a quarterly analysis of the mortality figures, a significant variation in the quarterly mortality rates, largely winter quarters, was found when compared across the most recent 5 years (quarter 1 vs quarter 4, p=0.006; quarter 2 vs quarter 4, p=0.002; quarter 3 vs quarter 4, p=0.03). Mortality rates for quarter 4 remained high when compared to other quarters, however, within group analysis showed downward trend over the years which was not statistically significant (p=0.031). Also, the average LOS improved significantly over the years in an approximately linear manner and the apparent correlation became stronger from year to year (Table 1). However, there was no direct correlation observed between improved mortality rates and decreased LOS.
Comparison of crude mortality rates and average lengths of stay between quarters and whole years
In summary, the overall mortality rates improved over the 5 years and all three measures currently monitored by the mortality committee of the trust (CMR, HSMR, SHMI) tended to improve to a similar degree. The mortality trends were more informative than individual rates calculated at a cross-sectional point. Apparent excess mortality detected at points in time could therefore be misleading.
Responses within the organisation
Interestingly, the project team found that clinical directorates and individual clinicians were highly supportive of the full range of interventions despite the additional time burden of mandatory MM meetings. The reasons for this are clearly complex, but important factors reported by clinical staff include wholehearted support from senior management (particularly the trust medical director and chief executive), additional financial resources committed to quality improvement and a deep-seated organisational culture that acknowledged the value of work to improve outcomes generally and mortality rates in particular. Within a few months of the start of the primary intervention, all directorates had adopted the required frequency, content and reporting structure for formal mortality meetings. Attendance levels by consultant staff were initially high and have been sustained, at least partly due to the requirements of annual appraisal.
Discussion
Our findings indicate that a persistent hospital-wide approach to general clinical quality improvement, coupled with focused analysis of selected clinical topics and specific cases is associated with a falling trend in hospital mortality. An important learning point to emerge from this study is the need to pay heed to clinical practice across the full range of activities and not simply focus attention, and resources, on specific conditions. This appears to be especially important once exceptional but easily identified causes of excess mortality, for example methicillin-resistant Staphylococcus aureus, have already been tackled.
Further, our study suggests that trends in mortality rates should act as the primary driver for quality improvement programmes and changes in clinical culture and configuration. For example, the improvements we observed in mortality trends over winter quarters, even though winter mortality remained comparatively high, indicates that the planning for, and management of, high volume and high acuity quarters should be an important part of quality improvement projects.
We coincidentally found a reduction in mean LOS in hospital that approximately tracked the reduction in mortality rates. While it would be simplistic to infer any direct causal link between those observations, it seems likely that the interventions that improved the quality of care and, hence, mortality rate could also have led to shortened LOS. Specific examples that are strongly supported by anecdotal evidence is the timely identification and treatment of sepsis and AKI. Indeed, in the case of the latter there might be scope for further improvements by the use of artificial intelligence to anticipate AKI and other conditions in the future.11 Such technological developments underline the need for hospitals and other healthcare organisations to continually service and revise their quality programmes to take account of new methods to improve the care of their patients.
Though our experience is encouraging, there needs to be a note of caution when considering the generalisability of our approach. This is partly because of variations in the quality of mortality data between organisations. That is a limiting factor to any retrospective study of this type, as is the inevitable lack of a parallel comparison group and the near impossibility of capturing and describing the fine grain of day-to-day quality work at the operational level. Also, the methods employed for the measurement of hospital mortality remain controversial.12,13 There is no overall consensus on which measure is of the most value as a platform for mortality audit, quality improvement and service development. General acute hospitals inevitably have high CMRs and it is difficult, and potentially misleading, to establish a CMR threshold that indicates good or defines inadequate care, even when comparing hospitals that are superficially similar. The HSMR and SHMI and other indices deploy various adjustment criteria that have been shown to be sufficiently divergent to place the individual hospitals in the best or worst groups in mortality league tables depending on the index used.12–16 That said, it is clearly neither practical nor morally defensible to disregard mortality comparisons. An adverse HSMR or SHMI must be taken seriously and should always prompt a hospital to examine the reasons for the finding. This might be relatively straightforward when excess mortality rates are clearly confined to a particular code or set of codes, or a defined area of practice. Corrective action can then be targeted. Cause analysis is much more difficult when high mortality rates are diffused across a large proportion of the caseload, and corrective action is then correspondingly less easily defined and executed.16 To some extent, these factors can be understood and consequently taken into consideration in the methods embedded in the UK National Mortality Review and the analysis of the causes of mortality that form the principles of a structured judgement approach to avoidable mortality reduction as developed and recommended by the Royal College of Physicians and NHS Improvement.7,9 Organisations, mainly hospitals, in the UK and elsewhere have attempted to define thresholds for acceptable mortality rates, understand the reasons for exceeding such thresholds and build sustainable systems to monitor mortality status and take effective action. Such examples have usually employed a mix of national data and recommendations blended with local data, case mix, organisational culture, strengths and weaknesses to find a workable pattern.17 Our approach and subsequent action plan are similar to that taken in other large acute hospitals with comparable declining mortality trends.10,18,19 There is, therefore, growing evidence that a persistent, detailed and iterative approach to quality improvement in hospitals is effective. Comparable approaches taken in primary care and in specialised hospital units have also resulted in improvements but can be less confidently compared with our experience due to their different clinical substrate.20,21 Nevertheless, the overall principle of measure, analyse, plan, act and re-measure remains intact.
Conclusion
Most published studies of the systematic approaches taken to reduce hospital mortality have linked reductions to the measures taken to improve the management of the specifically identified diagnostic groups shown to account for the adverse local mortality rates. This has generally been observed irrespective of the mortality index used. The findings presented in this paper indicate that, after a code-targeted regimen has achieved initial reductions in mortality indices, a further progressive fall is associated with a broad-based incremental clinical quality improvement based on structured iterative mortality review, information sharing, informed service reconfiguration, evidence-based investment in equipment, and staff and trust-wide repetitive application of measures found to be effective. We suggest that all mortality indicators can be used to monitor improvements in mortality trends and the most effective pathway to low and sustainable hospital inpatient mortality is to deploy targeted and broad-based mortality reduction programmes simultaneously.
Acknowledgements
The authors wish to thank Grace Maughan (senior data analyst), Sandy Edington (associate director for service development) and Tony Spotswood (trust chief executive officer at the time of the study).
- © Royal College of Physicians 2020. All rights reserved.
References


Jump to section
Related Articles
Cited By...
- No citing articles found.