
ABSTRACT
Background Exception reporting is the main process in England to resolve issues related to junior doctor working hours. Concerns have been raised regarding variable report submission, but no significant exploration has occurred. This study assesses frequency of exception reporting and correlates it with frequency of working beyond rostered hours and overall satisfaction.
Methods National training survey (NTS) scores for ‘Overall Satisfaction’ and frequency of working beyond rostered hours was obtained for 26 randomly identified trusts throughout England and correlated with exception reporting frequency from guardian of safe working (guardian) quarterly reports covering April 2018.
Results Guardian reports were obtained for 24 trusts. NTS data suggest trainees worked beyond their rostered hours 12.1 times per quarter (interquartile range (IQR) 10.0–12.9) whereas guardian reports show they exception reported 0.15 times per quarter (IQR 0.084–0.25). Trainees exception report 1.2% of the time they work beyond rostered hours (IQR 0.8–2.4%).
Frequency of exception reporting correlates poorly with the frequency with which trainees work beyond rostered hours (coefficient −0.22) and with a marker of overall satisfaction (coefficient −0.21).
Conclusion The current exception reporting process significantly under-reports trainee working hours although there is regional variation.
Introduction
The guardian of safe working (guardian) role was introduced in England as part of the 2016 junior doctor contract to ‘represent and resolve issues related to working hours for the junior doctors’.1 Digital exception reporting allows instances of either working beyond contracted hours, missing breaks or education opportunities to be reported to the guardian. Most reports are for working beyond contracted hours. The guardian is required to submit a quarterly report to the trust board summarising collated data from these exception reports.2 While there is no requirement on how to present the data, a sample template is available as a guide.3
Despite widespread encouragement from major organisations (including the professional regulator, unions, royal colleges and NHS Employers) for trainees to submit exception reports, it is now widely accepted that exception reporting has only been successful in certain situations or settings and that ‘its overall effectiveness is being restricted by a number of systemic limitations’.4–7 A recent study exploring the topic via freedom of information requests suggested that, since 2015, junior doctors had worked beyond their contracted terms and conditions more than 63,309 times – the count of exception reports submitted.8 In response to this report, the chief executive of NHS Employers (the organisation that acts on behalf of NHS trusts) described exception reporting as ‘working well overall’ but acknowledged ‘there are areas where guardians of safe working hours and doctors tell us improvement is needed’.9 NHS England, in collaboration with major stakeholders, have set up a group to ‘address issues around exception reporting’.7
An early 2017 analysis of exception reporting data within one region of England showed very poor correlation between number of exception reports submitted and frequency with which junior doctors reported working beyond their contracted hours when this was looked at separately.10 The cause was unclear but one purported explanation of this disparity was the immaturity of the system at the time (it had only been around for a year) and that doctors weren't used to submitting reports. It was felt things may settle down with time and as trainees moved between organisations. Suggestions behind variation included fewer incidences of working beyond rostered hours, pressure on trainees not to report, better overall experience or simply trusts/departments that engage better with trainees encouraging them to report more actively. It's unknown whether with maturity the system has improved and whether it now correlates with actual frequency with which trainees work beyond rostered hours and thus whether the number of reports per trainee can be used to compare trusts.
Here, using results from spring 2018, we compare exception reporting frequency (reports per trainee per quarter) across England with trainees self-reported frequency of working beyond rostered hours at a similar point in time when asked anonymously via the General Medical Council's (GMC's) national training survey (NTS).11 We also compare exception reporting frequency with a measure of trainee overall satisfaction of working within that organisation as a first step to assessing whether number of reports suggests high or low organisational performance.
Methods
Study design
Twenty-six employers (healthcare trusts) were randomly identified from throughout England. Efforts were made to obtain quarterly guardian reports for the quarter covering April 2018 for these trusts and calculate from these the number of exception reports per trainee per quarter. For the same trusts, trainee self-reporting of frequency with which they worked beyond rostered hours was obtained from the responses to the anonymous GMC's NTS allowing an approximation of the number of times trainees work beyond rostered hours per trainee per quarter. Correlation coefficients were then calculated comparing the two data sources. A marker of trainee ‘overall satisfaction’ was also obtained for each trust from the NTS and this was correlated with number of exception reports per trainee per quarter.
Trust identification
Two trusts were randomly identified from each of the 13 Health Education England regions of England. Trusts were randomly selected from a list generated by the GMC's NTS filtered by ‘Trust/Board’. Each trust in a region was allocated a number and random.org was used to select two numbers in the region.
Trainee self-reported data
The GMC's 2018 NTS was open between 20 March 2018 to 09 May 2018. Respondents to this survey expect a reasonable degree of anonymity with no results released for any category where there are fewer than three respondents. Results are available online, broken down by trust and individual survey question.11 Results for the question ‘In this post, how often (if at all) have you worked beyond your rostered hours’ along with the number of respondents was extracted by filtering by ‘Trust/Board’ and expanding the ‘Work Load’ domain. Responses had the option of being ‘Daily’, ‘Weekly’, ‘Monthly’, ‘Less than once a month’ and ‘Never’. The number of respondents is given as a five-number range eg 426–430 and the central number in this range was used as the number of respondents.
Frequency with which trainees on average worked beyond their rostered hours was then calculated using a few assumptions: a trainee works 11 weeks in a quarter (allowing for 6 weeks’ annual leave and 2 weeks’ study leave per annum split evenly) and works only Monday–Friday on those weeks. Thus, a trainee reporting daily work beyond rostered hours was assumed to have done this 55 times in a quarter. To approximate the number of times that trainees work beyond rostered hours per trainee per quarter this figure was divided by the number of trainees completing the survey.
A trust score for overall satisfaction was extracted by using the ‘Overall Satisfaction’ domain score after filtering by ‘Trust/Board’. This is a number already calculated from the mix of questions making up the domain with higher values showing better satisfaction than lower.
Guardian of safe working reports
Efforts were made to obtain the quarterly guardian reports covering April 2018 as this was the middle month of the NTS survey. A stepwise approach was followed for obtaining these reports: searching the identified trust website for ‘guardian of safe working’ or ‘guardian’; reviewing all board meeting agendas/minutes from May to August for inclusion of this report; an email request to the secretary of the trust board; and a freedom of information request. If no response was heard, a further email was sent 28 days later. The website searches were done in early–mid-January 2019, the first emails all sent on 24 January 2019 and follow up emails on 21 February 2019 and trusts were given 4 weeks to respond. If a trust redirected an email, the thread was followed up till the report was obtained or they didn't respond to a reminder.
From these reports, the total number of trainees, number of trainees on the 2016 NHS doctors and dentists in training contract (TCS) and the total number of exception reports was extracted from the text, tables or graphs, and estimated from the graphs if no exact figure was given. Piloting showed many reports didn't have the number of exception reports purely for hours (and not for educational reasons) but, in the author's experience, well over 90% of reports are for hours. Reports also didn't often state the number of trainees who could submit exception reports as, while it is a requirement for trainees on the 2016 TCS to be able to submit exception reports, it is highly variable whether trainees not on the 2016 TCS can also do so.12 For calculation purposes it was assumed only those on the 2016 TCS could submit exception reports and that all reports were for hours. Where trusts didn't report number of trainees on the 2016 TCS the number of doctors was estimated by multiplying the number of doctors from the NTS survey by 1.16 (the average of the difference between the NTS number of trainees and those trusts reporting numbers). For the few trusts who reported 4-month ‘quarters’ the number of exception reports was multiplied by 0.75 to allow comparison with other trusts. The number of exception reports per trainee per quarter was calculated from this data.
Statistical analysis
As data were expected to be non-normally distributed, scores for all three areas were ranked and Spearman's rank correlation coefficient was calculated manually using MS Excel comparing reports/trainee/quarter with each of the other two scores. Scatter graphs were created using MS Excel to allow visual assessment of any correlation. As there is significant controversy regarding significance of any individual correlation coefficient no specific cut off for finding correlation was pre-identified.
An estimation of the percentage of times a trainee stays beyond rostered hours that they exception report was calculated by dividing the average number of exception reports/trainee/quarter with the average number of times a trainee stayed beyond rostered hours/trainee/quarter from NTS data. The previously published 63,309 figure for number of exception reports nationally can then be divided by this percentage to give a more accurate approximation of the number of times that trainees on the new contract had actually worked beyond rostered hours in the period they studied (August 2016 – July 2018).
Results
Of the 26 trusts identified, 12 guardian reports were available on the trust website and a further 12 were obtained following email exchanges with the trust. NTS data was obtained for all 26 trusts.
NTS data for all 26 trusts suggested trainees worked beyond their rostered hours an average of 12.1 times per quarter (interquartile range (IQR) 10.0–12.9; range 6.4–20.9). For the 24 trusts for which guardian reports could be obtained, there was little difference: average 11.9 (IQR 9.8–12.8; range 6.4–20.9). Full results are shown in supplementary material S1.
Of the 24 guardian reports obtained, 17 trusts reported the number of doctors on the 2016 TCS, the remaining seven had number of trainees calculated as defined earlier. In total, 1,341 exception reports were recorded. Analysis showed that trainees exception reported an average of 0.15 times per quarter (IQR 0.084–0.25; range 0.030–0.65). Full results are shown in supplementary material S1.
Comparison of the frequency of exception reporting with the frequency with which trainees worked beyond rostered hours is shown in Fig 1a; Spearman's rank correlation coefficient is –0.22. Fig 1b compares the NTS ‘Overall Satisfaction’ domain score with the frequency of exception reporting; Spearman's rank correlation coefficient is –0.21.
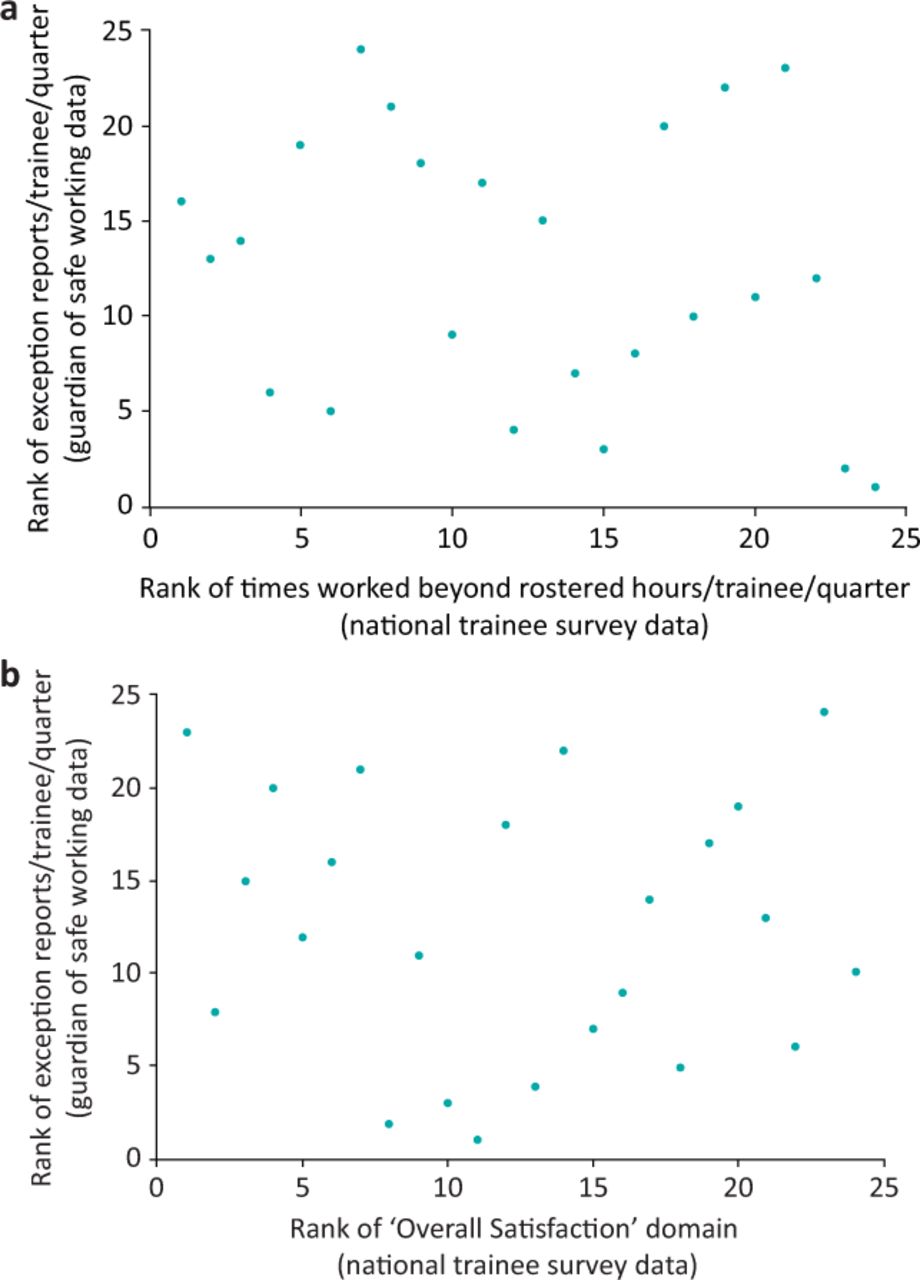
a) Comparison of number of times working beyond rostered hours with number of exception reports. b) Comparison of overall satisfaction with number of exception reports.
On average, trainees submitted exception reports 1.2% of the times that they worked beyond rostered hours (IQR 0.8–2.4; range 0.1–6.5). A more accurate reflection of the number of times trainee doctors have worked beyond rostered hours in the period August 2016–July 2018 is therefore around 5 million.
Discussion
Principal findings
This study suggests that trainees exception report a very small amount (1.2%) of the time they work beyond rostered hours. It shows a lack of correlation (coefficient –0.22) between frequency of exception reporting and frequency with which trainees report staying beyond rostered hours suggesting that, in 2018, frequency of exception reporting cannot be used to compare organisations. It also shows a lack of correlation (coefficient –0.21) between the frequency of exception reporting and a measure of trainee overall satisfaction suggesting that overall satisfaction isn't a key factor in whether or not trainees exception report.
Strengths and weaknesses of the study
This study design has multiple small sources of error and one more significant one. Specifically, it assumes trainee responses to NTS regarding working beyond rostered hours was accurate. Although this is an anonymous survey, it still relies upon accurate recall and has very broad ranges that significantly impact the results. At its worst, a trainee that in reality works beyond rostered hours every other day could respond as it being either daily (thus doubling the frequency) or weekly (which is under half as often). Less significant errors are introduced at various other stages: the guardian reports have slightly different quarters, don't consistently differentiate reports for hours or education, and it is unclear whether trusts count trainees not on the 2016 TCS in their guardian reports. It is unclear in which direction these will affect results. The randomisation method ensures both good geographical spread and also different types and sizes of trusts are represented.
Meaning of the study
This is the first England-wide study looking at frequency of exception reporting and comparing it with trainee self-reported frequency of working beyond rostered hours. The lack of correlation suggests significant local factors influence whether trainees submit reports or not. One of these factors is not trainee overall satisfaction. A recent survey of predominantly surgical trainees showed only 2% reported all unscheduled hours worked and another study of higher specialty physicianly trainees showed only 9% had exception reported in the last year.13,14 These studies looked into why trainees didn't exception report and found similar themes, with many feeling it wasn't of value or wouldn't make a difference, some were actively discouraged or were afraid of reprisals, and some were unaware of the reporting process.
While achieving 100% reporting rate including minor breaches of hours is an ambitious goal, every organisation involved in the process believes trainees who regularly stay beyond rostered hours should exception report every time. Of the trusts identified in this study, NTS data shows 51% of trainees worked beyond their rostered hours either daily or weekly. The suggestion that ‘the [exception reporting] process is working well’ is therefore somewhat questionable as the reporting rate is quite markedly lower than would be expected for these cases.
Unanswered questions and future research
There is little benefit in repeating this study either with data from significantly more trusts or in the next year or two as it is unlikely to show any marked difference. While further exploration of reasons for not exception reporting is possible, the core reasons behind this have already been identified. The major area of work in this area going forward, therefore, needs to be into exploring what measures and techniques improve exception reporting numbers, possibly focusing upon local level changes. This study introduces the idea of calculating the percentage of times a trainee works beyond rostered hours that they exception report and this could be used to set targets for organisational change.
It is possible the current multi-organisational review of the process will introduce some improvement here and re-assessing the situation, after any changes brought by this are embedded, may be worthwhile.
Supplementary material
Additional supplementary material may be found in the online version of this article at www.rcpjournals.org/fhj:
S1 – Fuller dataset for the times when each trainee worked beyond rostered hours.
S2 – Fuller dataset for the exception reports per trainee.
Conflicts of interest
Matthew Roycroft worked for Health Education England in 2017/18.
- © Royal College of Physicians 2020. All rights reserved.


Jump to section
Related Articles
Cited By...
- No citing articles found.