
ABSTRACT
Using an online tool, we report the association between tasks and ‘affect’ (underlying experience of feeling, emotion or mood) among 565 doctors in training, how positive and negative emotional intensity are associated with time of day, the extent to which positive affect is associated with breaks, and consideration about leaving the profession. Respondents spent approximately 25% of their day on paperwork or clinical work that did not involve patients, resulting in more negative emotions. Positive emotions were expressed for breaks, staff meetings, research, learning and clinical tasks that involved patients. Those having considered leaving the profession report more negative feelings. Systematic workplace changes (regular breaks, reducing paperwork and improved IT systems) could contribute to positive workday experiences and reduce intention to quit. Educators and employers have important roles in recognising, advocating for and implementing improvements at work to enhance wellbeing with potential to improve retention of doctors in training.
Introduction
Levels of work-related stress and burnout among doctors are suggestive of harmful working conditions. High-intensity shift work, lack of breaks and inadequate sleep have all been posited as potential culprits.1 Such working conditions not only result in poor or even dangerous care but could also contribute to the desire, by doctors in training, to leave the medical profession.2,3
The standard method of capturing working conditions is to ask respondents directly.4 The UK's General Medical Council has surveyed doctors in training for the past 10 years and achieved very high response rates. This has provided the wider system with an extremely rich source of data about the experience of training and patient safety in the UK. However, it is a single retrospective snapshot of experience in a single training post and more focused on issues in the system rather than individual factors.5 The UK Medical Careers Research Group (MCRG) survey asks questions such as ‘How much have you enjoyed the [foundation year 1] F1 year overall?’ or ‘How satisfied are you with the amount of time the F1 year has left you for family, social and recreational activities?’6
Kahneman argues that these types of questions (what he calls ‘attitudinal’ measures) require a respondent to summarise in one measure their experience of the job. He argues that such answers are likely to be biased by extremes of experiences as well as being combined with more reflective judgements about the social context of their work.7 For example, respondents that are asked about their overall enjoyment of work might focus on one occasion in which they felt low levels of enjoyment and forget about occasions in which they enjoyed their work.
An alternative way to measure working conditions is to ask about the ‘lived’ day-to-day experience of employees, during or shortly after the experience. The standard approach to the measurement of experienced well-being in everyday life is the ecological momentary assessment (EMA), which polls people during the day about their momentary affective state.8 The Day Reconstruction Method (DRM) developed by Kahneman and colleagues is more easily implemented than the EMA because it asks people to recollect activities and ‘affect’ (underlying experience of feeling, emotion or mood) within a 24-hour window, and has less impact on immediate day-to-day work activities. Validation studies have found that the DRM shows acceptable validity against the EMA.9
While there are a few studies that use the DRM to measure job satisfaction, as far as we know, none has applied it in the healthcare professions.10–13 Part of the reason is that the traditional methods for fielding the DRM use pen and paper diaries which are time consuming and cumbersome. Our study uses an online tool that facilitates easy use of the DRM and illustrates its benefits with a representative sample of trainee doctors within Health Education England (Wessex) in the UK. We believe that this real-time attitudinal survey capturing emotional components of work experience has the potential to complement other surveys and provide insights not yet available through standard survey methodology.
The advantages of the DRM include the combined assessment of activities and subjective experiences, and information about the duration of each experience. Importantly, it also allows us to gain insight into how trainee doctors feel about different tasks. The DRM therefore provides valuable information about how the workday of doctors in training might be improved through re-allocating tasks or providing better support to help them complete disliked tasks (such as paperwork).
The inability of doctors to take regular breaks during the day has become a major issue. The 2016 report Being a junior doctor reported how inadequate rest spaces and workload pressures were leading to a lack of breaks and potential burnout.14 In 2019, the BMJ launched a campaign called Give us a break to publicise the need for doctors to take breaks.15 The DRM is also well positioned to look at whether taking a break is associated with improvement in the daily ‘lived’ experience.
Survey method
This study was assessed and approved by the ethics committees of the University of Southampton and Auckland University of Technology. Survey participants gave informed consent before taking part. The population sample was drawn from the entire cohort of 2,181 trainees who were registered at Health Education England (Wessex) at the end of June 2018. The study consisted of three surveys, all of which were completed online. An initial screening questionnaire was used to exclude respondents who were not rostered to work in the next month. Remaining respondents completed a ‘baseline survey’ (part 1) about demographic characteristics, subjective well-being and intention to stay in the medical profession. At this stage, respondents also uploaded their rota for the coming week (start times and end times).
In the second part, up to five 2-hour ‘survey windows’ were randomly chosen from the respondents’ upcoming shifts. On the chosen day, participants received an email at the start of the workday to say that day had been selected as a survey day. They then received an alert at the end of the 2-hour window with a link to the MyDay tool. This is a web-based tool developed by Auckland University of Technology accessible by secure weblink on a handheld or desktop device. They were given 24 hours to reconstruct what happened and how they felt during the 2-hour survey window.
The MyDay tool asked the respondents to list all the tasks they performed during the 2-hour survey window from an exhaustive list of 33 tasks. These tasks were initially generated by the research team to try and provide enough granularity and offer respondents tasks that were meaningful. The initial task list was piloted with a free-text feature which allowed respondents to write down tasks. The final task list used the pilot tasks and these additional free text tasks (see supplementary material S1 for a list of the 33 tasks).
These tasks were aggregated into 10 categories for ease of analysis, with the mapping from task to categories done by four medically trained clinicians.
Patient facing clinical eg assisting with procedure under supervision, outpatient clinic and taking patient history.
Colleague facing clinical eg contacting medical staff over telephone and presenting patient to senior doctor.
Information and communications technology clinical activities eg checking imaging results, responding to bleeps/emergency calls and looking up information related to patient care.
Paperwork eg reviewing/updating patient notes, booking patient for surgery and requesting imaging.
Research/learning eg taking part in a teaching/learning activity and academic research activities
Theatre eg assisting in theatre.
Ward round.
Staff meetings eg non-patient related discussion with colleagues and looking up information unrelated to patient care.
Break.
Commuting eg commuting to/from home and travel between work sites.
For a randomly selected list of five tasks, respondents were asked to nominate how much time they spent on that task and also to rate the intensity of their feeling on a 7-point Likert scale, with respect to feeling friendly, happy, impatient, hassled, tired, worried, joyful, competent, criticised and frustrated during the time they performed the tasks.
The third part of the survey consisted of the workplace survey, which respondents could answer up to 8 weeks after completion of the baseline survey (part 1). The workplace survey asked more details about their working conditions, including supervision.
A total of 924 respondents (42.3%) completed the baseline survey (part 1). Of these, 61 were not eligible to complete MyDay surveys as they were not in placement at the time of the study. A further 565 respondents completed at least one MyDay survey of a possible five (part 2). An average of 2.9 MyDay surveys were completed. Twenty per cent answered only one MyDay and 19% answered five. A total of 1,690 MyDay surveys were completed, providing data on 6,687 tasks. Tasks where some of the affect variables were incomplete were dropped, thus 5,793 task-person responses remained.
Analytical methods
To validate the data, we used a similar approach to Kahneman by plotting the level of tiredness over the day, to see if results corresponded to those observed in EMA studies.7 We chose to look at both the time of day and time elapsed since the start of the shift. We plotted the reported average tiredness across all tasks against the hour of the day (on a 24-hour clock). For the plot of tiredness and elapsed time since the survey window, we calculated the minutes since the start of the survey window in 30-minute intervals.
To address which tasks were most liked or disliked, we estimated an ordinary least squares regression which allowed us to calculate the association between each task and each affect. The regression controls for personal characteristics: sex, training level (core, foundation and other), years in training, age and marital status. We also included controls for the time at which the task was performed and the minutes since the task started.
For the 5,793 task-person observations, we have reported intensity of feeling by that person with respect to that task across four positive and six negative domains. We calculated a single index ‘net affect’ as the sum of intensities of feeling responses for each positive affect (competent, enjoyed, friendly and happy) and subtracting each negative affect (criticised, frustrated, hassled, impatient, tired and worried) in turn. This net affect was converted into a standardised z-score so that the coefficients from the regression could be interpreted.
We next estimated a single regression, with a single dummy for each task (with breaks being the excluded category). We report the estimated coefficient of each task category, describing how performing this task relates to the net affect compared with taking a break (with ‘breaks’ as the reference category). Because there are multiple observations (days and tasks) per respondent, we applied clustered standard errors at the individual respondent level.
In addition to studying how tasks impact on net affect, we also examined how having a break moderates affect related to tasks. We calculated the intensity of positive and negative affect in time windows when respondents reported a break. Of the 5,858 specific tasks for which we had duration and affect information, 178 tasks were breaks. We split the 5,680 non-break tasks into those that occurred in a 2-hour survey window where the respondent reported a break (1,156) and where no break was reported (4,524). We plot these on a radial plot (after converting them into z-scores) using RStudio (RStudio, Boston, USA).
Lastly, in the baseline survey, respondents answered questions about their intention to quit medicine. We look at the association between this and average affect experienced during the day as recorded in the MyDay surveys. Intention to quit was coded as respondent considered leaving the medical profession within the last 6 months. As the dependent variable is binary, we applied logit regression and calculated the marginal effects (at the mean). All analysis was conducted using Stata/SE v14.2 (StataCorp, College Station, USA).
Results
Table 1 shows the descriptive statistics. Of the sample, 58% are women, and the average age is 31 years. Sixty-two per cent of the study sample are married and the average time in training is 5.7 years. Fifteen per cent are in core training, 22% are in foundation training and 63% are in specialty training. Fifty-seven per cent of respondents had considered leaving the medical profession within the last 6 months.
Descriptive statistics of study sample, total number of respondents n=565
Table 2 presents the average length of time within a typical 8-hour shift that the respondents report spending on each task. The 30 minutes spent on break conforms with the requirement that junior doctors have a 30-minute break for 5 hours of work.16 The majority of time (almost 3 hours) is spent with patients undertaking clinical work. An additional 92 minutes is spent on non-patient facing, largely IT related tasks that are associated with clinical work. Interestingly this is significantly less time than was reported from a US study in ambulatory care where twice as much time was spent on IT related tasks compared with direct patient facing clinical care.17
Time spent on task (in a typical 8-hour shift)
The subjective assessment of tiredness over the 24-hour day shows some of the expected patterns including low tiredness around 11am and a peak in mid-afternoon (Fig 1).18 Respondents reported higher levels of tiredness as their shift progressed (Fig 2).
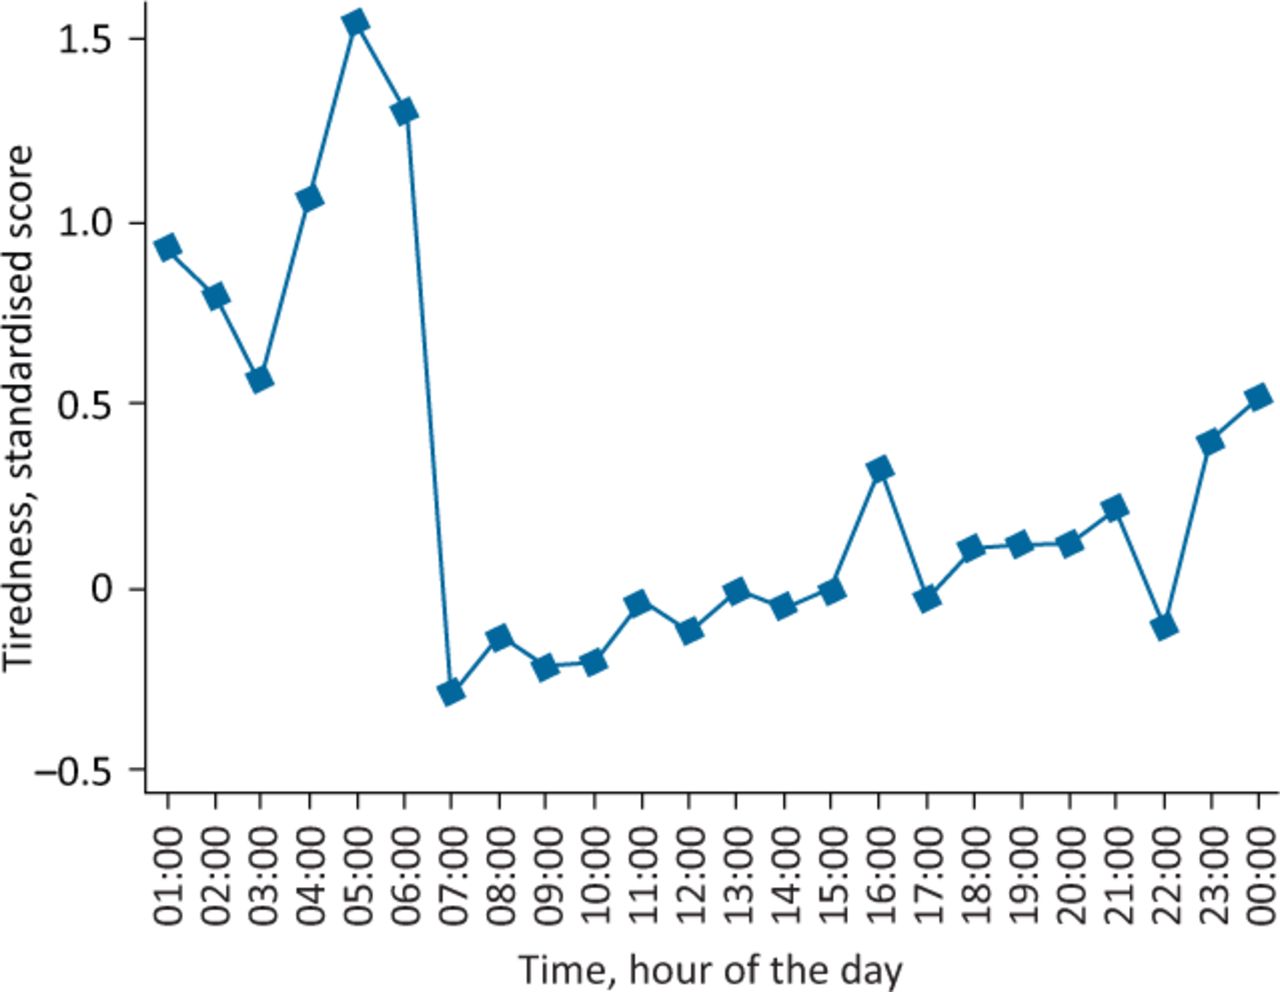
Reported tiredness against time during the day (as measured as mid-points of 2-hour response window).

Tiredness against time since the start of the shift.
Supplementary material S2 shows the adjusted difference in the net affect with the selected task (using breaks as the reference category). Compared with taking a break, a negative net affect is associated with all tasks. The largest difference is observed for paperwork and requests (–2.140), ward rounds (–1.875) and IT facing clinical tasks (–1.761).
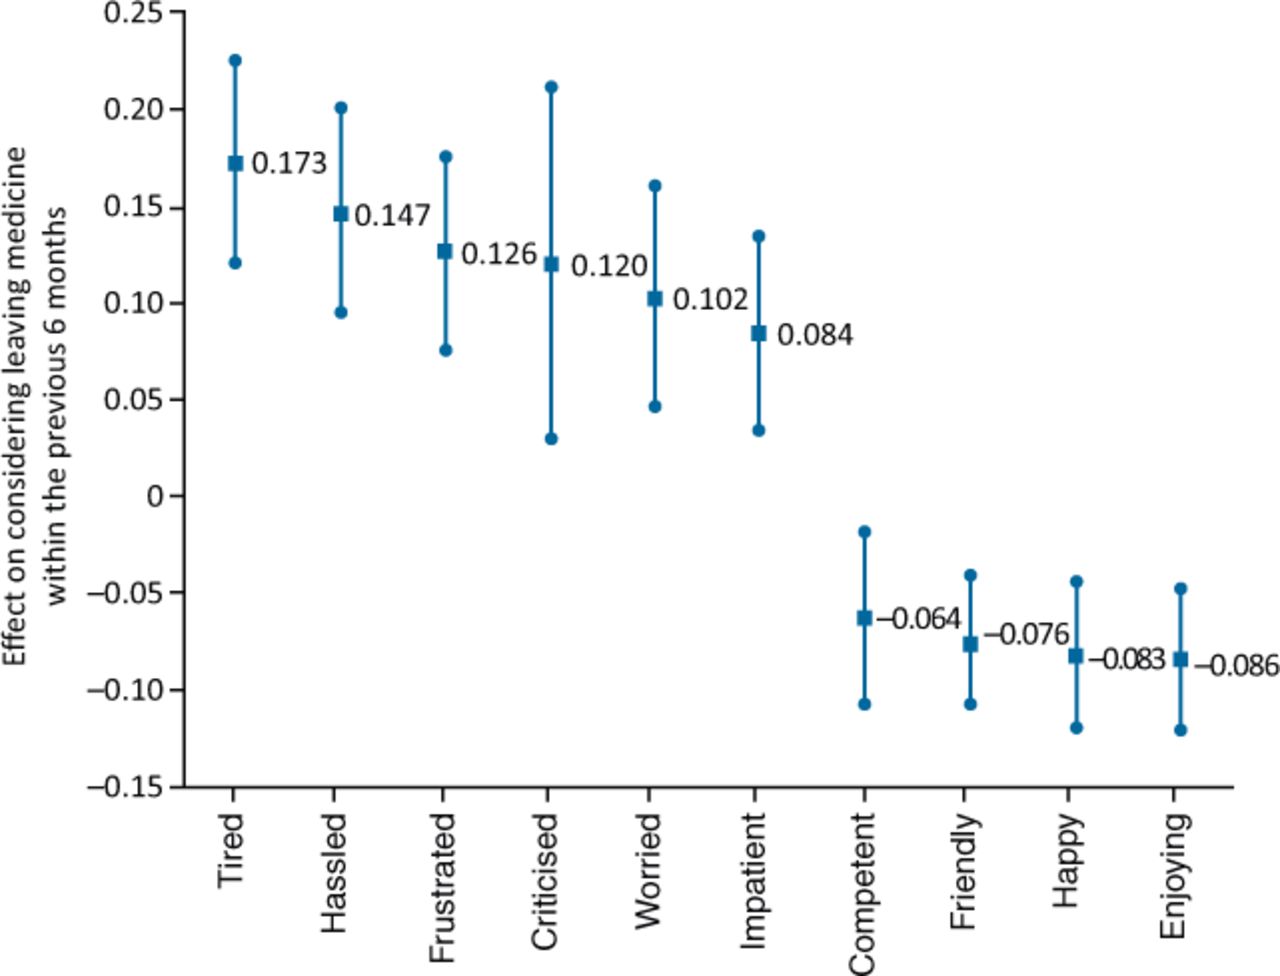
Fig 3 shows the association between average affect recorded during the MyDay surveys and the intention to quit, reported in the baseline survey as having considered leaving the medical profession in the last 6 months. Our findings from logit regression of intention to quit on average affects reveals that intention to quit is significantly associated with average tiredness, frustration, impatience and worry felt during the workday. A single standard deviation higher rate of tiredness reported during the day is associated with a 17% increase in having considered leaving the medical profession.

Marginal effect for mean affect score and probability of considering leaving (with 95% confidence interval).
Fig 4 shows the affect (z-score) associated with survey windows where a break was taken and where no break was taken. All differences are statistically significant, and the largest difference is in the feelings of frustration and tiredness, with the smallest difference being for competence and friendliness.

Average intensity of affect for break (blue) and non-break shifts (purple).
Limitations
A threat to the validity of our findings is that the population might not be representative of all trainees in Wessex. While we did not have a large amount of demographic data on the original 2,181 who were invited to complete the survey, we do have some broad summary statistics provided to us by the Wessex deanery. The study sample has 58% female compared with 57% in the Wessex data (chi-squared test for homogeneity p=0.97). The Wessex data also has 13% in core training compared with 15% in our sample (p=0.52), and Wessex had 30% in foundation training compared with 22% in the study sample (p<0.005). In terms of specialty representation, the share of respondents who are in anaesthetics, general practice and obstetrics are identical to the population. There are higher response rates from general surgery (12% vs 7%), paediatrics (9% vs 5%) and psychiatry (7% vs 4%) and a lower response rate from general medicine (42% vs 57%).
Our findings regarding breaks may not reflect a causal effect of breaks, but rather that respondents could only take breaks during times that they are not busy and, therefore, we are actually picking up a reverse causality. Further research would be necessary to try to identify whether taking a break does have a causal impact on negative and positive experiences.
Discussion and conclusion
The MyDay survey applying the DRM provides a unique insight into the quality of the working day of trainee doctors and suggests that systematic workplace changes (regular breaks, reducing paperwork and improved IT systems) could contribute to positive workday experiences and reduce the intention to quit. It was reassuring to note that, on average, doctors in training reported a 30-minute break for every 5-hour period worked, although there were clear differences in affect between those that did and did not manage to have a break. It is also important to note that half of shifts were spent on patient-facing tasks, which again were associated with more positive emotions.
The survey approach identified the tasks that are most closely associated with poor workplace experiences with respect to the strength of negative and positive feelings experienced while completing those tasks. More importantly, the association of negative and positive feelings with the intention to leave the medical profession provides evidence that the emotional experience of the working day might be driving trainee doctors to contemplate leaving, especially from feelings of tiredness and frustration. We acknowledge that this is an association rather than being causal, as it is possible that those already contemplating leaving the profession might attribute more negative affect to tasks. We feel that this is an area worth exploring further in light of the enormous costs of training doctors and the potential financial impact of doctors leaving a system already under economic strain.
We did find some evidence that respondents reported lower levels of frustration, impatience and tiredness on any task they performed when they had a break during the survey window in which they performed the tasks. We also found that tasks that involve greater use of IT (such as paperwork, requesting tests and filing forms) are associated with high levels of frustration among respondents.
Given that respondents are spending almost 25% of their day on IT related tasks, improving paperwork-based tasks could be a useful avenue to explore. Better user experience of IT systems, providing more assistance with paperwork tasks, or reducing the amount of paperwork required could improve the work-day experience.
Instituting regular breaks also seems to be a useful approach to explore. While respondents did take an average of 30 minutes of break (as stipulated by their contract), ensuring that these breaks are taken by everyone regularly could be valuable.
Educators responsible for these doctors in training, the medical profession and doctors’ unions all have significant roles to play in advocating for and ensuring that contractual reforms regarding breaks are implemented. Our study demonstrates the very positive emotions associated with breaks and the impact that workplace reforms can have on doctor wellbeing. Moreover, our study suggests that a longer-term outcome might result in better retention of the medical workforce. These changes, all within the gift of educators and employers, could have a significant impact on doctor wellbeing and, ultimately, patient care.
The addition of yet another survey to the busy working lives of doctors needs to be considered. The concept of ‘survey fatigue’ was anecdotally reported to the authors of this study and we were very aware that feedback of results was important to keep respondents engaged. During the course of this research, two face-to-face events were held for interested respondents to explain the methodology in more detail and to have a discussion about wellbeing in general. The addition of MyDay to the survey armamentarium needs to consider how feedback, and subsequent actions, are reported to respondents in order for them to recognise the value in participation.
MyDay uses an established survey methodology delivered in a novel and user-friendly electronic format to provide useful insights into the working lives of doctors in training. It also provides a new evidence base, not only for detailing emotional experiences which have to date been anecdotally reported but also for planned organisational interventions which can improve the working lives of an important part of the healthcare workforce. We hope that this data-driven approach to understanding the experience of the healthcare workforce might help employers consider novel approaches to workforce planning. For example, developing roles which might support medical staff with IT-related tasks allowing more patient-facing time, and consideration of rota design which allows for protected breaks, as has been done for other clinical staff. Access to real-time data, via a dashboard for example, could provide employers with valuable information about the emotional wellbeing of their workforce which could potentially signal impending burnout and allow workplace improvements to be made to enhance staff and patient experience.
Supplementary material
Additional supplementary material may be found in the online version of this article at www.rcpjournals.org/fhj:
S1 – List of 33 tasks available to choose for the 2-hour window.
S2 – Effect on intensity on net feelings associated with task categories.
Conflicts of interest
Prof Hockey was postgraduate dean at Health Education England (Wessex) at the time that this study was conducted.
Acknowledgements
The authors thank Health Education England (Wessex) for funding of the research fellows and Prof Karen Morrison, University of Southampton, for access to the ethics committee, University of Southampton.
- © Royal College of Physicians 2020. All rights reserved.


Jump to section
Related Articles
Cited By...
- No citing articles found.