
ABSTRACT
Background The order-up-to inventory model is a method for identifying and maintaining the optimal product level for items that that hold value over time and have recurring demand. Typically, supermarkets utilise it to manage stock-levels of non-perishable goods.
Local problem This project aimed to improve blood culture bottle supplies following reports by junior doctors of shortages when dealing with septic/unwell patients.
Methods Data regarding blood culture bottle use was acquired from four hospitals within one trust in London (245 wards). The mathematical ‘order-up-to’ inventory model (an iterative Poisson distribution) was applied to the 6 months' data.
Interventions The model found three predictable levels of demand to stock wards with no shortages in 99.3% of circumstances (based on historical data). Wards were stocked with blood culture bottles as per their required demand.
Results A collection method and infrastructure was designed to implement the new policy and was applied to a London tertiary centre. A review of doctors, nurses and ward-managers found significant improvements in supply with no shortages since the model was applied. Issues with the dataset were identified for intensive therapy unit / high dependency unit.
Conclusions The ‘order-up-to’ inventory model provides a useful tool within hospitals for improving stock levels of blood cultures bottles and with that the satisfaction of trainees and patient safety.
Introduction
Blood culture is a crucial part of patient management, allowing goal-directed and targeted treatment for severe infections. A positive blood culture in a patient is associated with a 12-fold increase in likelihood of death during hospitalisation, and poor short- and long-term prognoses when compared with the general population.1,2 It is critically important to take blood cultures in patients with sepsis, as a key component of the ‘sepsis six’ bundle within 1 hour.3–5 This test allows identification of causative organisms, appropriate choice of antibiotics and may direct further investigations to identify the source of infection. Successful implementation of this bundle leads to better outcomes and can reduce mortality by up to 40% if done within the hour.5–8 The greatest barrier to completing the bundle, according to junior doctors, is time pressure.9 Accessibility to the apparatuses of the sepsis six is a key factor in the time of delivery; shortages or unavailability of items will delay treatment.
In The Royal London Hospital (a tertiary care hospital in London), junior doctors raised concerns about lack of blood culture bottles on the ward and in sepsis trolleys in several meetings. This was a self-propagating problem as a lack of available bottles in store rooms led to people needing to use (and not replacing) bottles on the sepsis trolleys and staff stockpiling/hiding bottles for use. The greatest issue was on the acute and general medical wards, where the stocks would run out quickest, often over a single shift. Despite multiple complaints, no formal investigations were reported and no significant incidents occurred. In order to address the issue, a process was introduced mandating wards to request blood culture bottles from the pathology department twice a week. On the basis of usage data over the preceding 6 months, an estimate was made of the number of bottles they should request to avoid the ward running out. However, given how essential the bottles are and the number of times the issue had been raised by junior doctors, we decided to assess the stock level required more robustly.
The challenge with human-led ordering is that is can lead to the ‘bullwhip effect’.10 This term describes the effect of increasing fluctuations in quantity orders in the supply chain – and it can have a significant effect on hospitals.11 In the commercial sector, it is typically triggered by five mechanisms.
Over-reactive ordering: excess supply is ordered because a short-term spike in demand is perceived as a long-term change.
Order batching: large quantities are ordered periodically.
Order synchronisation: multiple orders are placed at the same time.
Shortage gaming: excess orders are placed in fear of shortages.
Forward buying: excess supply is ordered due to financial incentives.
In the micro-environment of a hospital ward ordering blood culture bottles from the pathology lab, this phenomenon plays out in multiple ways due to a lack of planning. For example:
multiple septic patients in a single week leads to a higher order (over-reactive ordering)
a big batch is ordered when bottles run out (order batching)
multiple wards order simultaneously after a drive from management to improve sepsis bundle completion rates (order synchronisation)
people report a lack of bottles so too many are ordered to compensate (shortage gaming)
an audit or management project assesses compliance with sepsis bundle protocol so many are ordered in advance (forward buying).
The consequence of these ordering regimens is that it leads to over-supply on some wards and shortages on others; it is also too inconsistent to accommodate variability in demand. In order to mitigate this, organisations use demand models to stabilise the demand–supply mismatch and provide a consistent level of stock. These models can be divided into made-to-stock, made-to-order and order-up-to. Made-to-stock is for products (such as newspapers) where there is high variability in demand day-to-day and the product loses value over the same period. Made-to-order is for bespoke products that are only supplied after they are ordered. Order-up-to is the model used for items that hold their value over time and have recurring demand. This final model allows the user to set a value for stock levels that should accommodate variabilities in demand, and allow re-ordering to this value on a regular period to maintain stock. For example, X number of blood culture bottles on the ward to accommodate for any week, and the responsive individual ensure that on a specific day each week there is X number of bottles on the ward.
This project aimed to address the shortages and inconsistencies in blood culture bottle levels through use of the order-up-to inventory model. Historical data over a 6-month period from 245 wards within the trust was used for analysis.
Methods
Data were obtained for all blood culture bottle requests on all wards in all four hospitals in the trust plus satellite centres (Barts Health NHS Trust: The Royal London Hospital, Whipps Cross Hospital, Newham Hospital and St Bartholomew's Hospital). These data were obtained by the local IT team who extracted the numbers of order requests for blood cultures on PowerChart software for all wards from April 2018 to September 2018 (inclusive). This amounted to 21,995 requests from 245 wards/locations.
To analyse these data, acceptable parameters needed to be found for:
service level (in-stock probability): the ability to provide a product when it is required
holding cost-rate: the cost of storing the items
lead-time: the time it takes to order a product
expected demand: the amount of products used within the time between order deliveries (ie lead-time period plus time between orders).
The holding cost-rate was assumed to be zero as blood culture bottles have no special storage requirements; they need only room-temperature environments away from direct sunlight or heat, and they do not depreciate the facilities they are stored in. A suitable cupboard or storage room (the minimum requirement) was assumed to be easily available in all wards and clinical spaces. The lead-time was set at 1 week to include the acceptable frequency of re-ordering for already busy nursing staff. The expected demand and service level needed to be calculated. However, theoretically, the service level should be as close to 100% as possible ie a blood culture bottle is always immediately available when needed.
Data were analysed using MS Excel and Graphpad Prism 7.
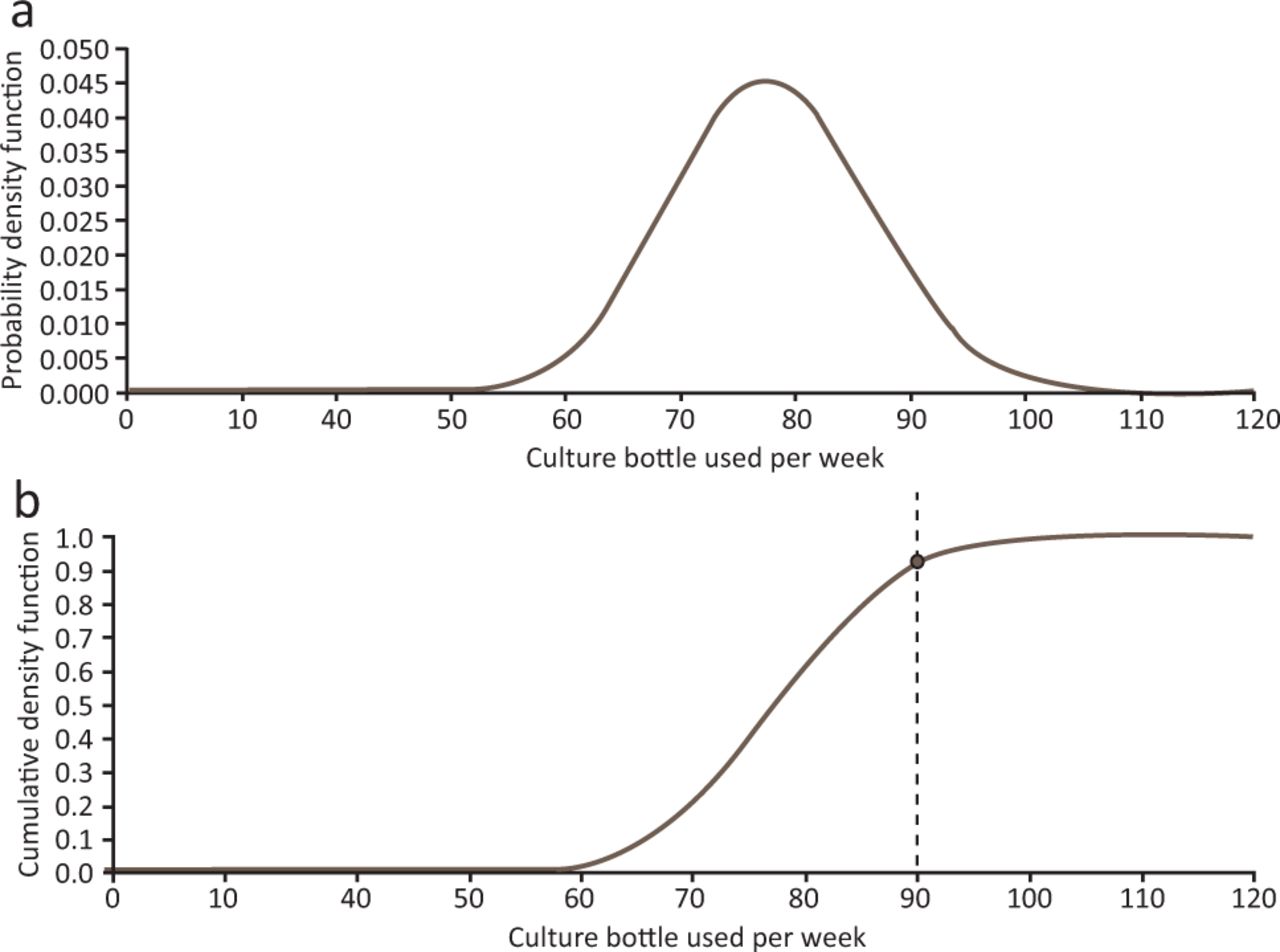
The data for each ward were digitally plotted as an individual Poisson distribution curve (using the ward's average weekly use as the mean of the distribution) such that the number of blood cultures required in any week was on the horizontal axis. For each ward, the weekly average and the historically highest demand over the period were considered. This ‘weekly highest’ total was then identified on the curve to determine where it occurred in the demand profile.
For example, for ward A, the weekly average was 78 and the highest weekly requirement was 90 over the time period. This aligned with the 92nd percentile on the Poisson distribution curve (Fig 1). This was interpreted to be equivalent to the maximum ‘service level’ (in-stock probability) historically required for that ward. Therefore, if the service level was set at 90, there would be an 8% chance that in any week more than 90 bottles would be required. As such, a service level that was above this level would accommodate the fluctuations in demand for ward A.

a) Poisson distribution curve for ward A with a mean of 78 bottles per week. b) Cumulative distribution function of the Poisson distribution for ward A, the weekly maximum (90 bottles) lies on the 92nd percentile.
Service level percentiles were then calculated for all wards. Descriptive statistics (eg mean) and maximum service levels were noted.
The demand across all 245 wards was then plotted as a Poisson distribution curve and the number of bottles required at the maximum service level determined. This value represented the maximum number of blood culture levels required by any ward anywhere in the trust. This value could then be used as the number of bottles required on the ward during the weekly inventory check to accommodate for fluctuations in demand.
Evidently, this value would be significantly higher than what is required for most wards since many wards rarely deal with septic patients. Using only the maximum service level for weekly stock inventory would lead to wastage as certain wards would rarely use their stock and this would be discarded when the stock expiry date was reached. In order to mitigate this, three service levels were chosen; this considered both the maximum service level and tried to minimise mathematical errors by selecting familiar numbers (15, 25 and 35 bottles). These values were selected such that the service level value selected for each ward was higher than the maximum ward/hospital service level identified earlier in the calculations.
The policy in the hospital was then changed so that a nominated ward staff member would ensure on a weekly stock check that X number of bottles were available on the ward. If there were any fewer than X, they would order that amount such that the total then became X (hence ‘order-up-to’).12
Three months after the policy change, interviews were conducted with hospital staff (Fig 2). Doctors, nurses and ward managers/clerks from 20 wards in the Royal London Hospital were asked about their experience of shortages, their awareness of the policy change and their implementation of it.
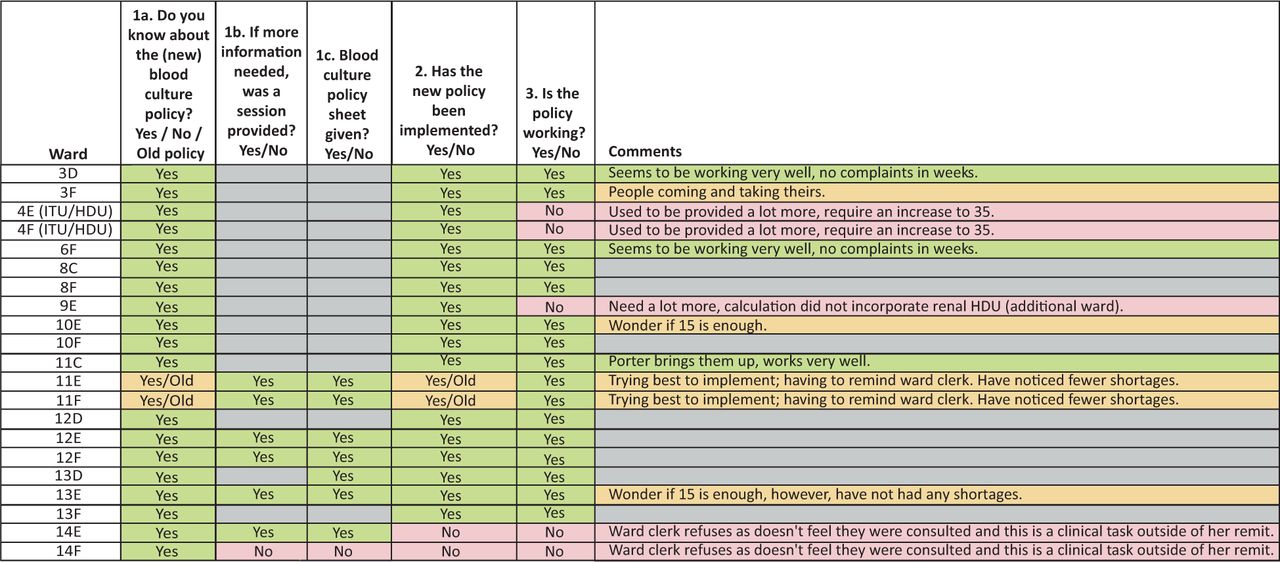
List of open questions asked to staff on each ward. The wards not available were 7th floor (paediatrics), 8B/D (neonatal), 12C and 13C. HDU = high-dependency unit; ITU = intensive therapy unit.
Results
Over the 6-month period, 21,995 requests for blood culture bottles were made across 245 wards/centres. While some outpatient centres and elective minor procedures units had a weekly average of zero bottles (n=4), all 245 areas required at least one blood culture bottle over that time period.
When determining the service level for each ward, the maximum percentile documented was 99.3%. This means that, in its peak week, the ward required a number of bottles in the 99th percentile of its demand distribution curve. The following descriptive statistics for service levels (maximum historical demand) across all wards were obtained.
Mean: 90.8%.
Median: 92.2%.
Mode: 95%.
90th percentile: 97%.
95th percentile: 98%.
99th percentile: 99.3%.
Values above 99% led to numerical/calculation errors on the software so were not obtainable. This is because a service level of 100% would mean that there was always a blood culture bottle for any circumstance or fluctuation in demand, and this is only mathematically possible with an unlimited supply.
It was determined that the safest option would be to use the historical maximum such that the service level was set at 99.3% for requirements, and this aligned very well with the 99th percentile for demand across all wards. This was interpolated from the distribution curve for all wards. At this point, accident and emergency admissions were excluded from the policy because their demand was so much higher than the hospital wards (weekly averages 30–50 bottles higher) although their initial inclusion was necessary for calculating the variability of demand.
Through the service level of 99.3%, the highest demand for the wards of blood culture bottles was set at 35 bottles per week. In this case, there ought to be an available bottle in 99.3% of circumstances; unless in one very atypical week the ward uses more than 35 bottles and thus there are insufficient numbers available.
For simplicity, use of bottles on wards was stratified as ‘low’, ‘medium’ and ‘high’ demand. Numerically, this was equivalent to stock levels of 15, 25 and 35 per week, respectively. These values were compared with the maximal historic use on that ward and deemed appropriate if the suggested stock level was above the 99.3 percentile for that ward.
The policy was amended so that, on a weekly basis, a member of staff would ‘order-up-to’ the allocated stock level. For example, if ward X had an allocation of 35 and there were only 20 bottles on the ward during the stock check, the nominated individual would have to order 15 more (allocated stock level minus level on the ward).
Three months after implementation of the policy, two doctors, the nurse-in-charge and the ward manager/clerk of each ward (20 wards) in the Royal London Hospital were interviewed about the impact of the new policy. Specifically, they were asked about whether they had noticed shortages, whether the policy was used and if it was working (and if not, why not).
This process demonstrated that all wards were aware of the policy; however, four wards were not using it (as they had no issues with the old policy). The wards not using it were given a printed copy of the new policy and advised accordingly. All doctors reported no recollection of any shortages of blood culture bottles on the ward in the 3 months after introduction of the new system (this was noted in junior doctor meetings that followed also). The nurses reported being pleased that they now had a system to follow. Their frequency of ordering had also reduced from the previous twice weekly to once weekly re-stocking. The ward clerks were also satisfied with the new system.
However, this process also identified that the levels were insufficient for the intensive therapy units (ITUs) and high-dependency units (HDUs) at The Royal London Hospital. For the renal HDU, this was because their historical use had been split between the two adjacent renal wards on the initial dataset: they were not an allocated ‘ward’ on the computer system. For the separate ITU and HDU, their under-representation on the dataset (and initial service level of 25) was due to separate point-of-care testing trials that meant fewer requests were sent to the lab. To mitigate this, the ITU/HDU allocations were stepped up to 35, which was sufficient on later review.
The major limitation of the policy, however, was the initial supply of blood culture bottles. As many wards were running stock levels that were very low, the pathology lab originally struggled to then provide enough base stock to each ward so that they were compliant with the policy. However, as the ordering improved, all wards were then able to comply.
Discussion
This project demonstrates that it is possible to use mathematical models (often used outside the NHS) to improve services within hospitals. Prior to its implementation, the lack of available culture bottles on the ward meant junior doctors felt frustrated and unable to complete the sepsis bundle in a timely manner.
In this approach, blood culture bottles were considered similar to a supermarket item that was non-perishable because their use significantly out-stripped their expiry date (2 years plus). The historical values from a 6-month period were then used to create demand-distribution (Poisson) curves to determine the variability of demand based on orders of blood culture bottles per ward per week. It is this fluctuating week-to-week demand that leads to shortages, as individuals are unable to calculate how many bottles would be needed to accommodate for it. In the old policy, where one individual would order more bottles twice a week with no set protocol, the variability in demand influences their decision-making through the mechanisms described earlier, leading to the ‘bullwhip effect’. This is not good for critical resources such as blood culture bottles as it leads to over-stocking in some areas and under-stocking in others. It is also not beneficial to patients, where accurately isolating the sepsis-causing organisms can improve antibiotic choice and stewardship.
The variability of demand across the trust was calculated through using the historical values and determining where each ward's maximum weekly requirement sat on the demand (Poisson) curve over the time period. This found that, at its highest demand, wards needed a number of bottles in the 99.3 percentile of their demand curve. This was deemed the safe ‘service level’ (in-stock probability), such that the model should accommodate for instances where the number of bottles ordered for the ward would be sufficient in 99.3% of weeks (equivalent to 363.5 days of the year). The data from all the wards was then plotted on a single distribution (Poisson) graph, and generated the upper value of 35 bottles per week.
It was not cost-effective or logical to store 35 bottles on wards that typically used less (and where this value would represent a service level of well over 99.3%). Therefore, the wards were stratified into three levels: low (15 bottles), medium (25 bottles) and high (35 bottles).
In practice, this meant that on a weekly basis, a member of staff would compare the current stock levels with the allocated number then order the difference (‘order-up-to’). Following implementation of the new policy, junior doctors reported no shortages of blood culture bottles in direct interviews or meetings. Nurses and ward clerks were pleased as the new protocol halved the frequency and time of stock checks and, also, because doctors were less frustrated.
The limitations of the study are similar to any data project, in that the analysis will only be as good as the quality of input data. In this case, the data identified for the ITUs and HDUs at The Royal London Hospital were incorrect, meaning they were allocated too low a stock value; this drawback was identified following implementation and analyses were not reproduced to exclude this data. Furthermore, the data were based on blood culture bottle requests (mandated for both bottles), it was not possible to obtain paired values for both orders and results as a single request could be reported on more than once (eg at different time intervals). Finally, only 6 months of data (26 weeks) was available and used, this may not cover all variations in demand. However, there were no reports of post-implementation shortages at 3 months, which suggests that the number of tests ordered is a reasonable value to use for modelling stock levels.
From a supply perspective, the major issue was that the pathology lab initially did not have enough inventory to match the new protocol, as wards were ordering up to their allocated values for the base stock levels. This restates the importance of involving stakeholders at earlier phases of planning. Other limitations include the current inability to automate this process, as suggested by staff, but this has been possible elsewhere. For example, in Portsmouth, inventory management software was successfully implemented to save hundreds of thousands of pounds, reduce wastage and release clinical time back to the patient-facing staff that was the equivalent of three full-time posts.13
In the future, such algorithms could form part of an automated stock-replenishing service; as is common in supermarkets. However, there are currently too many non-communicating software in use for this to be feasible (eg separate software for ordering, patient requests and stock requests).
Conclusion
The ‘order-up-to’ inventory model provides a useful tool within hospitals for improving stock levels of blood cultures bottles and with that the satisfaction of trainees and patient safety. It can be applied to any item in the hospital which has recurring demand and holds its value over time (non-perishables). Organisations should consider its application to reduce the occurrence of shortages of essential items on the wards.
- © Royal College of Physicians 2021. All rights reserved.


Jump to section
Related Articles
Cited By...
- No citing articles found.