


Introduction
Health Technology Assessment (HTA) decisions represent a key point within the complex decision making process that governs funding and access for pharmaceuticals in many health care systems. HTA decisions are of interest because of their implications for patients, health care providers, funding bodies, technology manufacturers and health policy makers. Successful implementation of HTA requires multi-disciplinary assessment of the range of social, economic, clinical and health care system organisational consequences stemming from the introduction of a new technology relative to the existing standards of care (Henshall et al., Reference Henshall, Oortwijn, Stevens, Granados and Banta1997; Velasco Garrido and Busse, Reference Velasco Garrido and Busse2005; HTAI, 2007; EUnetHTA, 2011). Therefore, it is important to understand what factors are in fact driving HTA decisions.
Established in 1999, the National Institute for Health and Clinical Excellence (NICE) is responsible for providing guidance to the National Health Service (NHS) in England and Wales on the funding of new technologies and their use (Chalkidou, Reference Chalkidou2009). There are four types of guidance that NICE provides including: clinical guidelines, public health guidelines, guidelines on safety and efficacy of interventional procedures and recommendations on ‘health technologies’ (such as surgical interventions and pharmaceuticals; NICE, 2008b). One of the key rationales for setting up NICE was to help tackle the geographic inequality in access to technology or the phenomenon more frequently referred to as ‘postcode prescribing’ (Summerhayes and Catchpole, Reference Summerhayes and Catchpole2006). Since 2002, NICE's recommendations have been mandatory and NHS organisations have had to comply, usually within three months.Footnote 1
Within NICE, the Centre for Health Technology Evaluation focuses on issuing guidance on the appropriate use and funding of technologies. The NICE HTA process involves a panel of clinical, academic and industry stakeholders and the general public (NICE, 2008a). Appraisals by NICE are governed by the use of established standard methodology for the evaluation of clinical and economic characteristics of the technology (NICE, 2008a; Littlejohns et al., Reference Littlejohns, Garner, Doyle, Macbeth, Barnett and Longson2009). As outlined in its methods guide (NICE, 2008a), a range of clinical criteria are evaluated during a NICE appraisal and the submission of cost-utility evidence is an integral part of the process. In addition to economic and clinical criteria, the patients’ perspective and patient evidence, as well as the perspective of carers and other members of the NHS, are taken into consideration via the consultation and stakeholder submission processes. NICE operates a process that emphasises the roles of social values in decision making (Littlejohns et al., Reference Littlejohns, Garner, Doyle, Macbeth, Barnett and Longson2009), especially during appraisal of clinical effectiveness and cost-effectiveness evidence (NICE, 2008b). Social value principles considered by NICE include a focus on promoting equality and key ethical principles in decision making, including the notion of ‘procedural justice’, a principle through which NICE is committed to “ensuring that the processes by which healthcare decisions are reached are transparent, and that the reasons for the decisions are explicit” (NICE, 2008b, p. 12).
Given the multidimensional nature of NICE decision making and the high degree of stakeholder involvement, it is hypothesised that decisions are influenced not only by the evidence supporting the technology, but also by the assessment processes used and the context in which they operate. The overall objective was to examine the impact of evidence, process and context factors on decisions made by NICE to recommend, restrict or not recommend new technologies for use in England and Wales.
Method
Hypothesised drivers of HTA decision making
It was hypothesised, based on the literature available, that HTA decisions were driven by the HTA decision-making process, the evidence considered within that process and by the socio-economic and political context in which those decisions were made (Figure 1). Research on the impact of evidence on the HTA decision has shown that the evidence related to the medicine or other technology under review (whether clinical, economic or otherwise) can influence HTA decisions [see for example, (Devlin and Parkin, Reference Devlin and Parkin2004; Dakin et al., Reference Dakin, Devlin and Odeyemi2006; Clement et al., Reference Clement, Harris, Li, Yong, Lee and Manns2009; Mason and Drummond, Reference Mason and Drummond2009)]. For instance, previous studies of NICE decision making have highlighted the significant impact of clinical evidence as well as the incremental cost-effectiveness ratio (ICER) (Devlin and Parkin, Reference Devlin and Parkin2004; Dakin et al., Reference Dakin, Devlin and Odeyemi2006). The literature has also raised questions about the degree to which NICE decisions may be influenced by the nature of the disease for which the technology is indicated. There has been particular focus on cancer therapies and the degree to which there may be flexibility in the criteria used to appraise technologies, given the severity of the disease and clinical needs. A review of NICE appraisals related to cancer technologies suggested that there was an increase in non-recommendation over time, although not statistically significant (Mason and Drummond, Reference Mason and Drummond2009). In contrast, NICE has also been characterised as being more flexible in its application of a cost-effectiveness threshold to cancer therapies (NICE, 2009). This presents an opportunity within this analysis to further investigate as to what extent disease characteristics influence NICE decision making, when taking into account other confounding factors.

Figure 1 HTA decision making: hypothesised drivers. HTA = health technology assessment
The literature examining the HTA appraisal process provided insights into a number of process-related factors that can potentially influence HTA decisions (e.g. Al et al., Reference Al, Feenstra and Brouwer2004; Menon et al., Reference Menon, Stafinski and Stuart2005; OECD, 2005; Vuorenkoski et al., Reference Vuorenkoski, Toiviainen and Hemminki2008). Within NICE decision making, the use of multiple technology appraisals (MTA) or single technology appraisals (STA) process has been hypothesised to affect decision making (Barbieri et al., Reference Barbieri, Hawkins and Sculpher2009). MTA and STA are two appraisal processes used by NICE to issue guidance on technologies. The MTA process includes a third-party review and analysis of the clinical and economic evidence, whereas the STA process relies on manufacturer-provided information (Barbieri et al., Reference Barbieri, Hawkins and Sculpher2009). However, the lack of an adequate sample size and the use of descriptive rather than multivariate analyses impeded the authors from examining the role of appraisal process on NICE decisions. Therefore, it was identified as an area of interest for this analysis. Finally, reference in the literature was made to the impact of the overall health care and welfare characteristics on HTA decision making, such as health care spending per capita, societal willingness to pay, the structure of the health care system, as well as ethical and social considerations (e.g. Ross, Reference Ross1995; Owens, Reference Owens1998; Buxton, Reference Buxton2005; Packer et al., Reference Packer, Simpson and Stevens2006; Bryan et al., Reference Bryan, Williams and McIver2007). In their model of NICE decision making between 2000 and 2003, Dakin et al., (Reference Dakin, Devlin and Odeyemi2006) found a statistically significant effect of the time of appraisal on outcome; therefore, it was of interest to establish whether this effect was observed in later appraisals.
Thus, based on the analytical model, the hypotheses tested in this analysis of NICE decision making were:
• Whether the ICER significantly affects NICE decision making; specifically, whether an increase in the ICER decreases the odds of recommendation.
• Whether technologies for cancer therapies increase the odds of recommendation relative to non-recommendation.
• Whether the use of an MTA process increases the odds of restriction relative to recommendation, compared with the STA process.
• Whether non-recommendations and restrictions are increasing over time relative to recommendations.
In testing these hypotheses, the study also sought to make comparisons with previously published models of NICE decision making (Devlin and Parkin, Reference Devlin and Parkin2004; Dakin et al., Reference Dakin, Devlin and Odeyemi2006).
Sample
The pharmaceutical technology appraisals performed by NICE formed the basis for the sample included in this analysis. The composition of the sample was determined through the following inclusion and exclusion criteria. The sample included all pharmaceutical technology appraisals (as opposed to medical devices or other interventions) performed during the period 2004–2009, indicated for an adult population. A five-year time horizon was used to capture a sufficient number of appraisals for analysis. Technology appraisals were excluded from the analysis for any of the following reasons: (i) they focused on a non-adult population (aged <18 years); (ii) the appraised technologies were non-pharmaceutical interventions; (iii) marketing authorisation was withdrawn; or (iv) the full guidance was not available.
Outcome variable
The analysis was designed to reflect as closely as possible the way NICE makes its decisions. To this end, a three-category outcome variable was used where technologies were recommended, restricted or not recommended. A three-category outcome variable was preferred over a binary outcome variable (i.e. covered vs not covered), as it better reflected the multiple coverage options available to NICE. Ranking of the three potential outcomes was not implemented as ranking of outcomes can vary according to the perspective adopted.
NICE guidance (summarised in section 1 of each guidance) indicates whether an intervention should be recommended or not for use in the NHS. A medication was considered as not recommended for use by NICE guidance if the words ‘not recommended’ were stated in section 1 of the guidance. To distinguish between recommended and restricted interventions, decision rules were developed to help classify which of the recommendations issued from NICE guidance were for routine use, and those that were for restricted use. Specifically, the Raftery classification was utilised to distinguish between restriction and recommendation (Raftery, Reference Raftery2006). Where a recommendation was made for a technology to be used in a population identical to its licensed indication, it was considered to be ‘recommended’. Where a recommendation contained one of the following provisos in relation to the technology, it was considered to be ‘restricted’: (i) it should be used in a sub-population of its licensed indication; (ii) it should be used in a second line or higher line of therapy; (iii) it required monitoring; (iv) it should be used at the lowest acquisition cost; or (v) it required prescription by a specialist (Raftery, Reference Raftery2006).
Explanatory variables
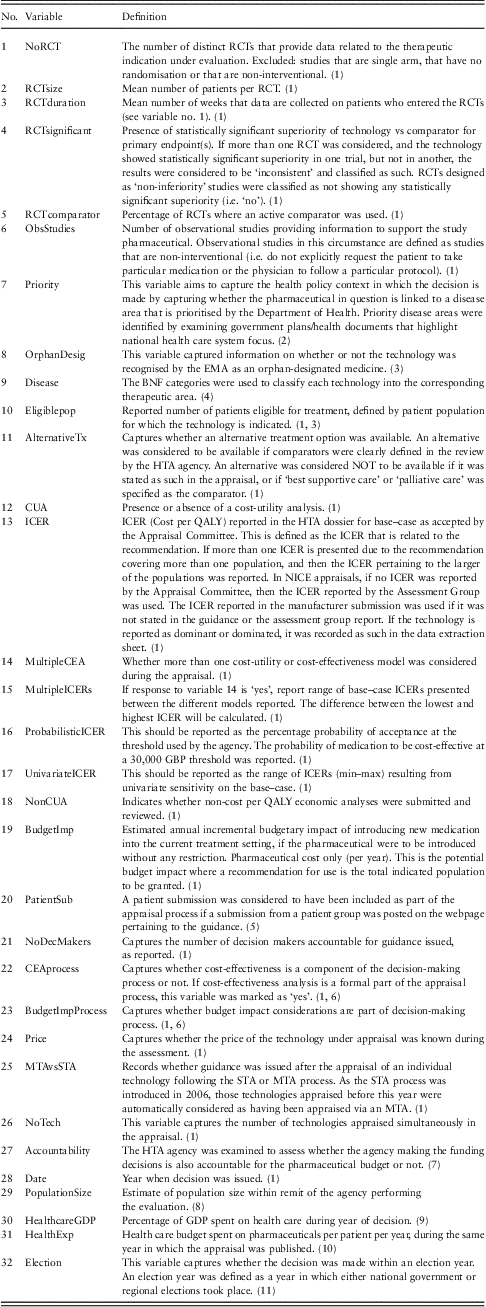
In line with the hypothesised drivers of HTA decision making, 32 variables were defined, including those relating to (i) the clinical and economic characteristics of the technology under appraisal [such as characteristics of randomised controlled trials (RCTs), use of observational data, ICER reported], (ii) the processes used to come to a decision (such as use of STA or MTA) and (iii) the socio-economic context in which these decisions were made [including percentage Gross Domestic Product (GDP) spent on health care, year of appraisal and if disease was identified as a priority]. These are shown in Table 1.
Table 1 NICE data set includes variables, definitions, data extraction rules and data sources
RCT = Randomised Controlled Trials; EMA = European Medicines Agency; BNF = British National Formulary; HTA = health technology assessment; CUA = cost-utility analysis; ICER = incremental cost-effectiveness ratio; NICE = National Institute for Health and Clinical Excellence; MTA = multiple technology appraisals; GDP = gross domestic product; STA = single technology appraisals; TAR = Technical Appraisal Report.
(1) TAR, sections 3–4; (2) Department of Health (2002, 2006a, 2006b, 2007); (3) EMA (2011); (4) BNF, Joint Formulary Committee (2010); (5) Section on NICE appraisal webpage (nice.org.uk) describing the history of the appraisal; (6) NICE (2009); (7) Sorenson et al. (Reference Sorenson, Drummond and Kanavos2008); (8) National Office for Statistics (2009); (9) OECD (2006); (10) Association of the British Pharmaceutical Industry (ABPI) (2010); (11) BBC (2005).
Data set
A database of information pertaining to NICE decisions and explanatory variables of interest was developed. To create this database, several steps were implemented. Publicly available sources of data containing information on the variables of interest were identified, and a data extraction form was developed to extract information from the different appraisals in a way that was as transparent, reproducible and consistent as possible. Finally, the resulting extracted data were coded and prepared for analysis. The variable definitions and data sources used are shown in Table 1.
Statistical analyses
A multinomial logit regression was used in the analysis to model the probabilities associated with the three types of technology appraisal outcomes (recommended, restricted or not recommended). We selected the ‘recommended’ outcome as the referent category in the analysis.
The objective of the analysis was to identify, ceteris paribus, the effect of a range of factors potentially associated with NICE appraisal decisions, and to assess which combination of factors best explains the pattern of NICE decisions. Given the wide range of factors considered in the analysis (see Table 1), a process was developed to determine which explanatory variables would appear in the final specification of the model. This process involved the following steps:
• First, bivariate regression models were run to ascertain the degree of correlation between individual explanatory variables and appraisal decisions.
• On the basis of these models, a subset of indicators was selected, which included those variables that showed at least moderate significance levels (indicators with a p-value below 0.25). A preliminary model was estimated including these indicators.
• The model was reduced by removing those variables with significance levels above the 0.10 threshold. To guarantee its stability, this ‘base’ model was re-estimated by sequentially removing one variable at a time and verifying the stability of the effects on the coefficient and significance level of the remaining estimates.
• The model was subsequently tested through alternative model specifications to examine its robustness and to assess the sensitivity of the results to different assumptions.
• As a final step, the base–case model results were presented to the representatives of NICE to seek feedback on the variables identified within the base–case model, the coefficient and level of significance to assess the validity of the model.
The application of the model-specification process outlined above facilitated the interpretation of the results of the models, while allowing the analysis to explore the impact of the wide range of indicators collected in the study.
Although significant effort was made to identify the information relevant to the variables of interest, a limited proportion of data could not be found and was therefore missing (see Table 2). To maximise the sample size, imputation techniques were used to estimate entries for missing values. Missing values were replaced with regression imputation estimates using the ‘impute’ command in STATA software [Intercooled (IC) Stata version 10.1]. The imputed values obtained were then checked manually to ensure their face validity. In addition, dummy variables were created to identify observations with missing data to test in the regression models whether the lack of data was significantly associated with differences in the outcome variable.
Table 2 Description of missing data within NICE data set 2004–2009

NICE = National Institute for Health and Clinical Excellence; ICER = incremental cost-effectiveness ratio.
A series of sensitivity analyses were performed on the base–case regression model to help evaluate the robustness of the results. The sensitivity analyses included: (i) examining the impact of a binary rather than a three-category outcome variable; (ii) restricting the base–case analysis to complete observations, thus excluding observations with imputed values; and (iii) estimating the model assuming ordinal properties of the outcome variable.
Descriptive statistics were calculated for each extracted variable, stratified by outcome group (recommended, restricted or not recommended). For categorical variables, the χ 2-test was conducted across the three outcomes, at a 0.05 significance level. With regard to non-categorical variables, analysis of variance and Kruskal–Wallis tests were carried out, at a level of significance of 0.05. Statistical analyses were performed using IC Stata (version 10.1 2009).
Results
Of 99 NICE technology appraisals, 65 were included in the analysis, representing 118 technologies. A total of 34 technology appraisals were excluded from the analysis for the following reasons: (i) they focused on a non-adult population (n = 5); (ii) they appraised non-pharmaceutical interventions (n = 23); (iii) marketing authorisation was withdrawn (n = 2); or (iv) full guidance was not available (n = 4). The majority of decisions restricted funding for the appraised technology (58%), 27% were recommended, whereas the least common decision was non-recommendation (14% of technologies).
Univariate analysis
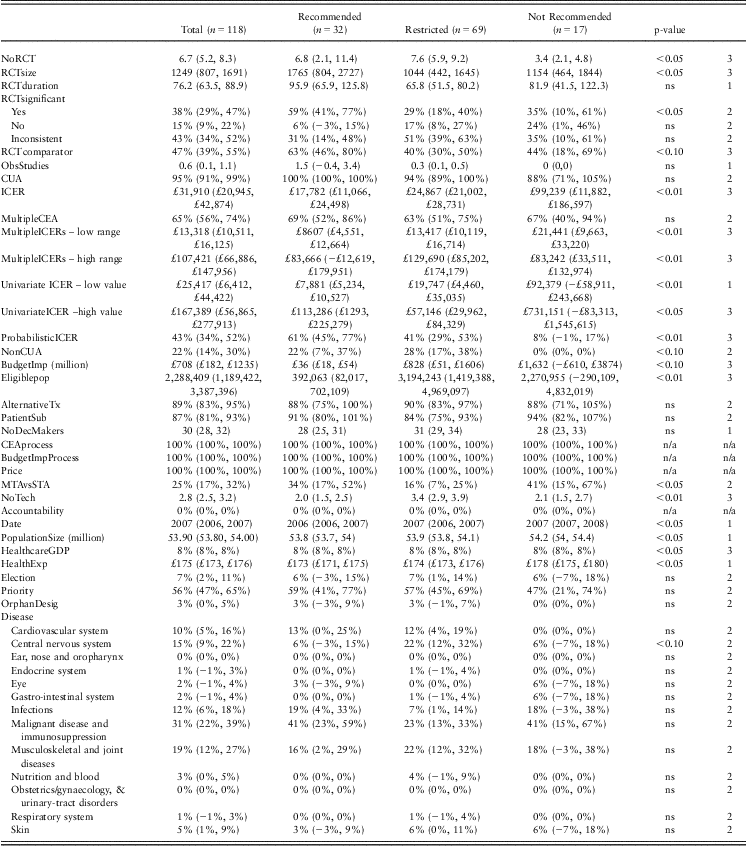
Of the 32 explanatory variables examined, descriptive analysis suggested that a subset of 20 variables may play an important role in determining NICE decision making (Table 3). Six variables related to the clinical evidence supporting the technology under evaluation. The first three variables described the nature of the randomised clinical trial data available in terms of the number of trials, sample size and trial duration. Interventions recommended for use or for restricted use were supported by a higher number of RCTs (mean of seven and eight trials, respectively), compared with interventions not recommended for use (mean three trials, p < 0.05). The mean size of the patient sample included in RCTs was higher for those interventions recommended by NICE (mean = 1765 patients), compared with those interventions restricted or not recommended by NICE (1044 and 1154 patients, respectively, p < 0.05). The mean trial duration across the three outcome groups was 96, 66 and 82 weeks, respectively (ns). Of the recommended interventions, 59% demonstrated statistically significant superiority, as opposed to 29% of restricted and 35% of not recommended interventions (p < 0.05). Recommended interventions were more likely to have active comparators within the RCTs (63%) than interventions that were restricted or not recommended (40%, 44% of RCTs with active comparators, respectively, p < 0.05). Very little observational data were referred to in NICE appraisals (the mean across appraisals was 0.6 observational studies, not significant across outcomes).
Table 3 NICE decisions 2004–2009: mean values for explanatory factors, stratified by decision (lower, upper 95% CI)
Test 1. Both ANOVA and Kruskal–Wallis test indicate similar level of statistical significance; Test 2. χ 2-test used as categorical variable; Test 3. Either ANOVA or Kruskal–Wallis test indicates statistical significance.
ns = not significant; n/a = not applicable.
The effect of economic evidence on NICE decision was significant. The majority of NICE decisions were backed by cost-utility evidence (95%). In 65% of decisions, multiple economic models were considered in the appraisal process and the use of multiple models was consistent across outcome categories. For the interventions supported by a cost-utility analysis, the ICER was significantly different (p < 0.001) between the recommended interventions (mean ICER of £17,782), compared with the restricted interventions (mean ICER of £24,867) and the interventions not recommended for use (mean ICER of £99,239). The probability of the ICER remaining below £30,000 was 61% for recommended interventions, 41% for restricted interventions and 8% for interventions not recommended for use (p < 0.01). With regard to univariate sensitivity analyses, the range of uncertainty was smallest for those interventions that were restricted for use (£19,747–£ 57,146), the widest range of uncertainty was observed for interventions not recommended for use (£92,379–£731,151; p < 0.05). Although the ICER is an important variable in NICE decision making, there are exceptions to its usefulness as a predictor of HTA decisions – there are recommended technologies with very high base–case ICERs, as there are technologies with lower base–case ICERs that are not recommended (Figure 2). This suggests the importance of examining a combination of factors to explain NICE decision making.
Figure 2 Base-case ICER(GBP) reported in NICE appraisals, by decision category (n = 90)
The effect of the appraisal process was found to be significant. On average, 25% of decisions followed the STA process – and this varied across outcomes: 41% of interventions that were not recommended for NHS funding followed the STA process, as opposed to 16% of restricted interventions and 34% of recommended interventions (p = 0.031). The number of technologies reviewed per appraisal was also statistically significantly different between outcome groups: restricted interventions were simultaneously appraised together with an average of 3.4 technologies compared with recommended and not recommended interventions (two technologies appraised simultaneously on average).
A range of socio-economic context variables varied significantly across NICE decision categories, including the year of appraisal, population size, health care expenditure as percentage of GDP and average health care expenditure per patient per year.
Multivariate analysis
The multinomial model showed significant associations (p = 0.10) between NICE outcome and four variables: (i) whether statistical superiority of the primary endpoint in the clinical trial was demonstrated by the appraised technology, (ii) the ICER, (iii) the number of pharmaceuticals appraised within the same appraisal and (iv) the year of the appraisal (Table 4). Specifically, demonstration by the technology under appraisal of statistically significant superior efficacy decreased the log odds of a restriction or non-recommendation (p = 0.006 and p = 0.016). A unit increase in the ICER increased the log odds of moving from a recommended to a restricted decision (p = 0.009) vs recommendation and a not recommended decision vs recommendation (p < 0.001). The number of technologies reviewed simultaneously within the same appraisal had a statistically significant impact on the decision between recommendation and restriction (p < 0.05) but not between recommendation and non-recommendation (ns). For every additional year, this increased the odds of a restriction (vs recommendation; p = 0.072) and the odds of a non-recommendation (vs recommendation; p = 0.028). When NICE decisions were regressed with these four variables, the resulting pseudo-R 2 was 0.26, suggesting that the four variables explained ∼26% of the variability in NICE decisions.
Table 4 Multivariate analysis of NICE decisions 2004–2009: base–case model results (n = 118)

NICE = National Institute for Health and Clinical Excellence; CI = confidence interval; RCT = Randomised Controlled Trials; ICER = incremental cost-effectiveness ratio.
Recommended technologies are the reference case.
Multinomial logistic regression, pseudo-R 2: 0.26.
Sensitivity analyses
A series of sensitivity analyses were performed on the base–case regression model to help evaluate the robustness of the results. The first sensitivity analysis assessed whether the impact of the explanatory variables on decision making varied if a binary outcome variable was utilised instead of the base–case three-category outcome variable. The logistic regression results using a binary outcome variable (covered vs not covered) no longer showed a predictive value for demonstration of clinical superiority (p = 0.657). However, in other aspects, the results are similar to the base–case analysis in that they confirm the impact of the ICER, number of pharmaceuticals appraised and the year of appraisal on NICE decisions.
In the second sensitivity analysis, the regression analysis was run for a subset of complete observations (n = 98/118). This sensitivity analysis was implemented with the knowledge that removing incomplete observations from the analysis could bias the analysis. The pseudo-R 2 for this model was 0.32, suggesting that this set of variables explains ∼32% of the variability observed in NICE decision making, as opposed to 26% in the base–case model. In this sensitivity analysis, the impact of the ICER and the year of appraisal remained similar to that observed in the base–case analysis: however, the impact of the demonstration of statistical superiority, as well as the number of technologies appraised simultaneously, was weaker in this sensitivity analysis as a statistically significant effect on the odds of non-recommendation was no longer observed.
In the third sensitivity analysis, ordinality of the outcome variable was assumed and ordinal logistic regression was used. The results of this analysis show very similar results to the base–case analyses.
Discussion
This study aimed to contribute to the literature on NICE decision making in several ways. First, it examined NICE decision making beyond its initial years: published multivariate analyses of NICE decision making have relied on data from 2000 to 2003, during the years following NICE's inception (e.g. Dakin et al., Reference Dakin, Devlin and Odeyemi2006). The results of this new analysis provide a complementary view on the characteristics of technologies reviewed by NICE beyond 2003, the factors that have continued to have an impact on NICE decision making and opportunity to examine change in NICE decision making outcomes over time. Second, this study aimed to complement extant studies of NICE decision making by considering new variables not previously examined. The value of this approach was twofold: it allows for the examination of impact of new variables on NICE decision making (e.g. impact of therapeutic indication or use of STA vs MTA processes); and it allows for the control of confounding factors in the multivariate analysis.
Finally, by increasing the number of appraisals included in the analysis, this study has greater statistical power when examining factors potentially having an impact on NICE decision making. For example, Dakin et al. (Reference Dakin, Devlin and Odeyemi2006) reported that regression analysis including cost per QALY data was not feasible because of the relatively small sample size. Therefore, the impact of the cost-effectiveness ratio was assessed combining both cost per QALY and cost per life year cost-effectiveness ratios and was not found to have a statistically significant impact on the regression analysis.
This study of NICE decisions suggests that a combination of clinical, economic and process factors explains decisions made by NICE to recommend, restrict or not recommend pharmaceutical technologies for use. The internal validity of the results obtained in this analysis was examined in two ways: first, by comparing the results with published analyses of NICE decision making, and second, by sharing the base–case model results for review with a leading member of NICE.
Pattern of NICE decision making
The pattern of NICE decisions observed in this analysis is not dissimilar to that reported in a study by Kanavos et al. (Reference Kanavos, Nicod, van den Aardweg and Pomedli2010), which examined NICE decisions in 2007–2009: that analysis revealed that, of the technologies appraised, 19% were recommended, 63% were restricted and 18% were not recommended. Clement et al. (Reference Clement, Harris, Li, Yong, Lee and Manns2009) examined NICE decisions between 2001 and 2008 and reported 87% of technologies as listed (recommended or restricted), leaving 13% of technologies as not recommended. Analysis of NICE decision making during the year 2000–2003 by Dakin et al. (Reference Dakin, Devlin and Odeyemi2006) reported that 21% of technologies were recommended for routine use, 66% were for restricted use and 13% were not recommended. Devlin and Parkin (Reference Devlin and Parkin2004) examined NICE outcomes using a binary outcome variable, and during the period 2000–2002 found that 71% of appraisals recommended use of the technology and 29% of appraisals did not. Therefore, the pattern observed within the data set used in this new study seems similar to that observed in previous studies, suggesting that the method of classification and data extraction used was robust.
Impact of clinical evidence and disease characteristics on NICE decision making
It was hypothesised that clinical variables, which were found to be significant explanatory variables in previous NICE analyses, would maintain their significance in this analysis. In the analysis of NICE decision making presented here, demonstration by the technology under appraisal of statistically significant superiority in its primary endpoint increased the odds of recommendation. Technologies recommended by NICE demonstrated statistically significant superior efficacy over the comparator in 59% of appraisals, compared with 29–35% of technologies that were restricted or not recommended. This result can be seen to reflect the role of evidence-based medicine in HTA decisions and the fact that NICE defines the value of the compound in terms of the ability of the technology to demonstrate, with greater certainty, its incremental clinical value through superiority-designed trials that provide stronger data to support a funding decision than technologies not able to provide evidence of superior efficacy. Comparing this result with previous studies, it is noteworthy that Devlin and Parkin (Reference Devlin and Parkin2004) did not measure the demonstration of clinical superiority, whereas Dakin et al. (Reference Dakin, Devlin and Odeyemi2006) measured this variable but did not find it to have a statistically significant impact, although the sample size was smaller than that used here, and their study examined appraisals made in 2000–2003.
It was hypothesised that technologies for diseases characterised by high unmet medical need may increase the log odds of recommendation relative to non-recommendation – with particular focus on cancer therapies. Through the model-specification process, the effect of cancer therapies on the log odds of non-recommendation was not observed and thus the final base–case model does not include this particular variable. The hypothesis was also not supported by univariate analyses: there was no statistically significant difference detected in the proportion of cancer therapies across NICE decision categories.
Economic evidence and its impact on NICE decision making
Consistent with previously published analysis of NICE decision making (Devlin and Parkin, Reference Devlin and Parkin2004; Dakin et al., Reference Dakin, Devlin and Odeyemi2006), the ICER had a significant impact. An increase in the ICER increased the odds of a restriction vs recommendation or non-recommendation vs recommendation, and this effect was highly statistically significant. The effect of the ICER was observed consistently throughout all of the sensitivity analyses performed. Thus, in addition to the strength of the clinical data, the incremental costs and benefits associated with the technology, and the resulting ICER, play a significant role in decisions by NICE. This interpretation of the multivariate model results is reinforced by a descriptive assessment of the mean ICER reported for technologies that demonstrated clinical superiority compared with those technologies that did not, suggesting that the ICER is a product of the clinical value demonstrated (Figure 3). It is recognised that ICERs represent a combination of inputs including clinical and economic variables as well as disease and patient characteristics. According to inputs used within an economic analysis, and the range of uncertainty accompanying them, this can lead to differing ICERs. It was on the basis of this knowledge that, in addition to the base–case ICER, the analysis included data on the range of base–case ICERs considered within the NICE review submitted by stakeholders, and sensitivity analysis/uncertainty estimates around the base–case ICER. However, these variablse were not found to have a significant impact on NICE decision making, when adjusting for other factors.
Figure 3 NICE decision-making: mean ICER stratified by demonstration of clinical superiority in RCT (n = 90)
The number of technologies appraised simultaneously affects NICE decision making
The multivariate analyses also suggest that there are process factors, beyond evidence considerations, which help to explain NICE decisions. An increase in the number of technologies reviewed simultaneously within the same appraisal increased the odds of a restriction relative to a recommendation. It was hypothesised that this may reflect the fact that NICE assessment processes differ according to the number of technologies under appraisal. However, when the model specification was altered to include a variable capturing the use of MTA or STA processes, the effect of this variable on NICE decisions was not statistically significant. It was suggested that the increased odds of restriction associated with higher number of technologies appraised simultaneously may reflect an approach in which a ‘winner’ is picked among the technologies, with the remainder recommended for restricted use or non-recommendation. Descriptive analysis was performed of NICE decision outcome, stratified by the number of technologies appraised (Figure 4): it suggests that the proportion of restrictions increases with the number of technologies appraised, and that non-recommendation appears to occur most frequently in appraisals with fewer technologies appraised simultaneously. None of the previous multivariate analyses of NICE decision making examined the role of process factors, and thus comparison with earlier findings is not possible.
Figure 4 NICE decision-outcome stratified by number of technologies appraised (N = 118)
Year of appraisal affects NICE decision making
In terms of the socio-economic context of NICE decision making, it was hypothesised that non-recommendations and restrictions are increasing over time relative to recommendations. The analyses show that the year of appraisal had a significant impact on NICE decisions – moving from 2004 to 2009 increased the odds of a restriction vs recommendation and non-recommendation vs recommendation (Figure 5). The year of appraisal may reflect multiple socio-economic factors, including the political climate, a change in key NICE staff, a change in societal preferences or the overall economic context. It should be noted that this analysis was performed before the implementation of changes in NICE appraisal methods, including criteria for consideration in the appraisal of rare diseases and cancer therapies. However, the analysis does cover the period where other key changes took place in the appraisal process, including the introduction of the Single-Technology Appraisal process as well as the 2008 update to the methods guide. By way of comparison, Dakin et al. (Reference Dakin, Devlin and Odeyemi2006) included this variable in their analyses and also found a statistically significant effect of the time of appraisal on outcome: an increase in the time of appraisal (i.e. as the appraisals came closer to the present), increased the odds of a non-recommendation. However, these authors did not find a statistically significant effect of appraisal date on the odds of a restriction relative to a recommendation.
Figure 5 NICE decisions between 2004–2009 (n = 118)
Limitations
Owing to limited resources, it was necessary to restrict the guidance included for analysis and number of factors taking into account NICE decision making. Although there are four types of guidance that NICE provides (NICE, 2008b), this analysis focused on recommendations on pharmaceutical technologies. This restriction on pharmaceutical technologies was done not only to increase the homogeneity of the sample for analysis in terms of homogeneity of the technologies included, but also to increase homogeneity in the approach to decision making, which can vary by type of guidance.
The variables included in this analysis represent factors for which indicators could be defined and coded, and for which evidence could be collected retrospectively. Although not representing the complete set of factors taken into account by NICE, they do represent the largest set of variables collected on NICE decisions and represent a range of factors hypothesised to explain NICE decision making. As the results show, the variables included in the analysis explain a proportion of the variance of NICE decision making, highlighting that there is some unexplained variance linked to variables that have not been captured in this analysis, or to the fact that some influences on decisions are simply random.
The database constructed for these analyses, incorporating information on appraisals performed by NICE from 2004 to 2009, was dependent on publicly available information. Thus, it is possible that subtle concepts or rationales discussed by the appraisal committee orally were not captured in the documentation of the appraisal. In addition, the dependence on public information meant that, in the situation where the information available was incomplete, it was not possible to ascertain whether this was because the information was never considered in the appraisal or whether it was considered but not recorded in the documentation. Incomplete observations were taken into account in the regression models by creating dummy variables to examine whether the presence or absence of information on that variable had any explanatory value. None of these dummy variables appeared to have a significant effect on the odds of NICE decisions. A sensitivity analysis was also performed in which incomplete observations were removed from the sample for analysis. The results of this sensitivity analysis were similar to those observed in the base–case analysis, suggesting that the factors identified in the base–case model are robust to alternative model specifications.
There was heterogeneity in the means through which technologies were restricted within NICE decisions. The notion of restriction within NICE decisions ranged from major restrictions, including restriction for use within a subset of the licensed indication, to minor restrictions such as the need for monitoring along with the use of the technologies. The notion of major and minor restrictions was suggested in research on NICE guidance by Raftery (Reference Raftery2006), in which various sub-types of restrictions were presented. O'Neill and Devlin also highlighted the variation in the degree of restriction related to NICE decision making (O'Neill and Devlin, Reference O'Neill and Devlin2010). It is a limitation of this analysis to have such heterogeneity in the degree of restriction within a single category. However, in its actual decision making, NICE has more than two coverage options at its disposal and thus the use of a third coverage category within the analysis reflected more closely real-life decision making. To test the impact of using a binary outcome variable on the base–case model results, sensitivity analysis was performed using a binary outcome variable, which confirmed the role of the factors identified in the base–case analysis.
Conclusion
The objective of this analysis was to examine the factors that influence decisions made by NICE to recommend, restrict or not recommend pharmaceutical technologies for use by the NHS in England and Wales. The analysis provided a rich source of data from which to examine the role of each factor on NICE decisions, and more importantly the contribution of each factor while adjusting for the effect of confounding variables. The results suggest that the variability in decisions observed can be explained by a combination of clinical, economic, process and socio-economic factors. The analysis showed that the proportion of restrictions and non-recommendations issued by NICE are increasing over time relative to recommendations. The analysis also confirmed that the demonstration of clinical and economic value is central to NICE decisions. While the NICE appraisal process was also shown to have an impact on decision making, the anticipated effect of the use of STA or MTA processes was not observed; rather, an effect was found for the number of technologies appraised simultaneously. New factors not previously reported to have an effect on NICE decision making were identified, including the effect of clinical superiority on NICE decision making, the effect of the ICER on the likelihood of both restriction and recommendation and that NICE decision making was sensitive to process variables as well as socio-economic factors. The results confirm the value of a comprehensive and multivariate approach to understanding NICE decision making.
Acknowledgements
The authors would like to thank Michael Drummond and Alistair McGuire for their valuable comments on the methods used and interpretation of analyses that were performed.
Disclosure statement: No funding was received for this study. Karin Cerri was an employee of Bristol-Myers Squibb during the time this research was conducted.


 Open access