
Abstract
The European Working Time Directive (EWTD) has resulted in large changes in the working patterns of junior doctors in the UK. All consultant physicians in England and Wales were invited to anonymously submit data on their teams for 11 am and 11 pm on 5 November 2009. Data on doctor number, grade, location and patient number were collected. Data were available on 887 hospital teams at 11 am and on 670 teams at 11 pm. At 11 am, the average number of patients per ward doctor was 11 (2–65). At 11 pm the average number of patients per doctor was 61 (1–400). Consultants were present overnight in 6.1% of teams. Doctors in the first two years of training were the most senior medical cover in 63 teams. Sickness rates varied between 1.5% and 3.5% for junior doctors, and were significantly higher in the second foundation year. Vacancy rates at the specialist registrar level were 8.6%. Trainees were available for training 66–80% of the time. These findings have significant implications for patient safety and quality of medical training in the UK.
Introduction
In August 2009, a 48-hour working week was introduced for junior doctors working in the UK under the European Working Time Directive (EWTD) legislation. The impact of this change on patient safety and quality of training has been fiercely debated in the medical and national media.1,2 Through these exchanges it has become clear that there is very little objective evidence of specific effects of EWTD on these parameters.3
National data on the number of doctors looking after patients during the day and night are not available. A small study from the Royal College of Physicians (RCP) in 2001 looked at staffing levels at night,4 but there is no regular mechanism for recording patient:doctor ratios, sickness rates for junior doctors nor the time trainees have available for training. Patient:doctor ratios are a surrogate marker of workload, training experience and patient safety.
This study was designed to assess the location of all junior doctors in medicine at 11 am and 11 pm on 5 November 2009 to assess patient:doctor ratios, team structures, sickness rates, vacancy rates and available time for training.
Methods
All consultant physicians in England and Wales were contacted by email using the consultant physician database held by the RCP. This database is annually updated based on information from the annual consultant census and appointment advisory committees. Consultant physicians were asked to report the exact structure of their team of junior doctors, the location of those doctors at 11 am on 5 November 2009, the number of patients being looked after by that team, as well as the strategic health authority (SHA) and size of the hospital the team was based in. Furthermore, consultants were asked to supply data on the make-up of the hospital team in charge of medical patients overnight, as well as the number of patients looked after by that team at 11 pm on the same day. Data were also collected on junior doctors’ sickness rates since 1 August 2009 and comments invited on specific issues with gaps in hospital rotas.
Trainee grades were classified as F1 (foundation year 1), F2 (foundation year 2), CT (core medical training years 1–2), ST (specialist and specialty training years 3–7) and SAS (specialty doctors and non-consultant career grade posts). Night-time grades included NNPs (night nurse practitioners), ‘consultant’ and ‘other’ (to cover all other personnel within the Hospital at Night team). Initial data forms were sent out on 6 November 2009 with a reminder sent on 13 November. The data collection was completed after 14 days. Data were collected anonymously using QUASK software and collated using Microsoft Access. Patient:doctor ratios were calculated by individual doctor (any grade), team (all junior doctors) and ‘ward team’ excluding specialist registrars (SpRs). Comparisons of patient:doctor ratio between SHAs and hospital size were made using the Mann-Whitney U test and sickness rates were compared using Fisher's exact test. Bonferroni correction was used for multiple comparisons.
Results
Data were received from consultants on 887 daytime teams (4,004 doctors below consultant grade) and 670 night-time teams (2,263 doctors below consultant grade) covering all SHAs in England and Wales. Responses were obtained from a representative proportion of all regions as shown in Table 1.
Responses were obtained from 26 of 28 medical specialties, with only medical ophthalmology and metabolic medicine not being represented.
Number of teams for each region in England and Wales on which data were received with patient:doctor ratios at 11 am and 11 pm on 5 November 2009.
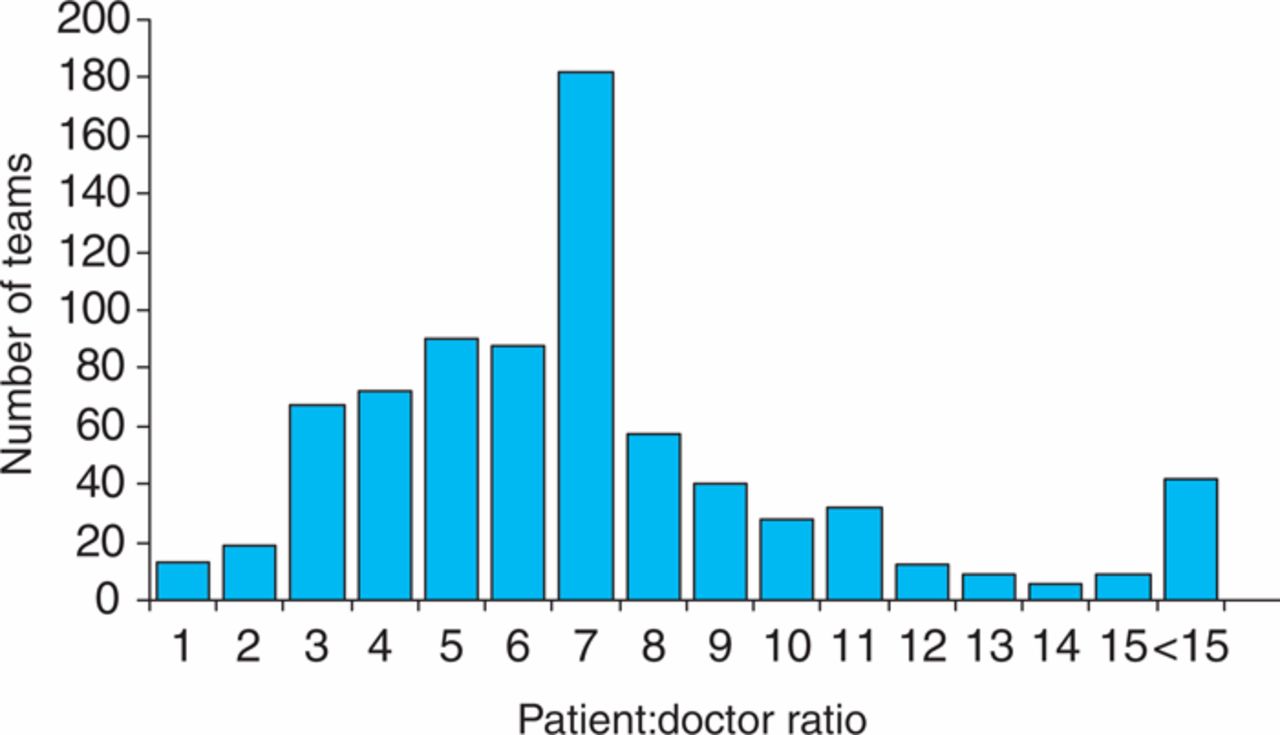
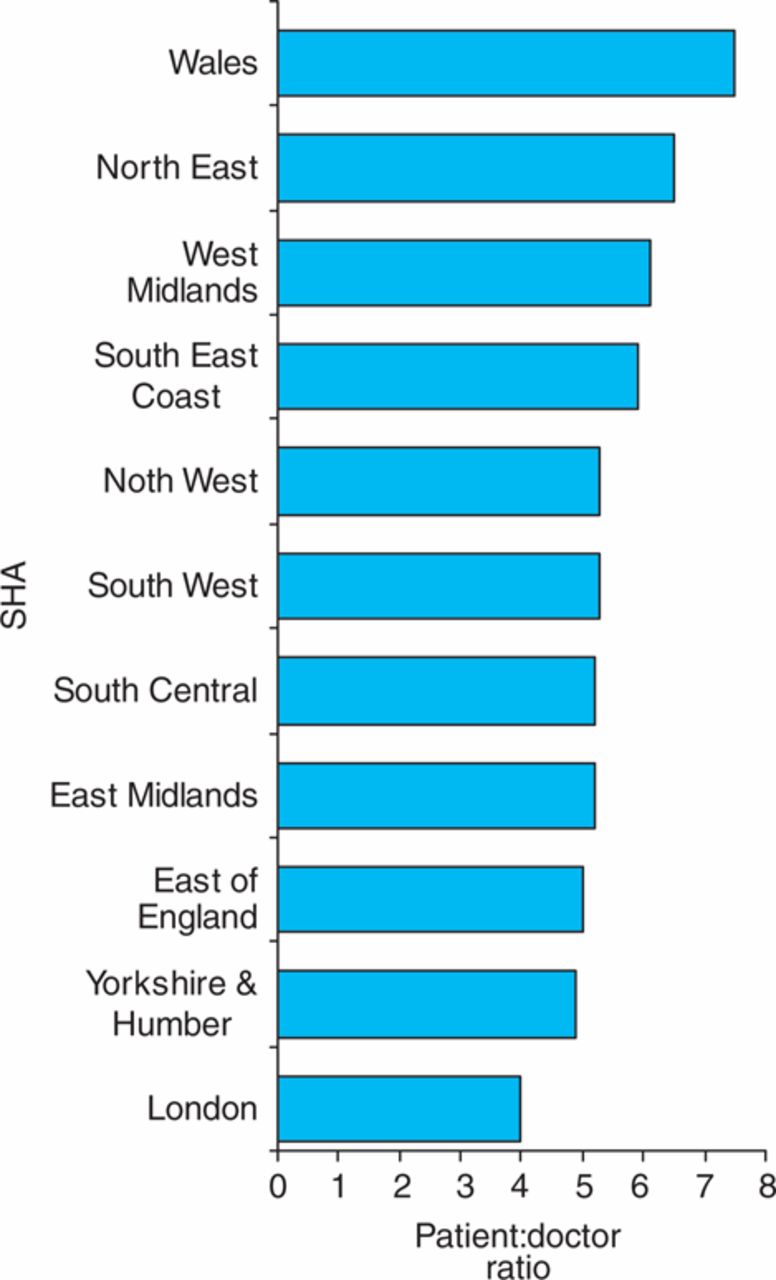
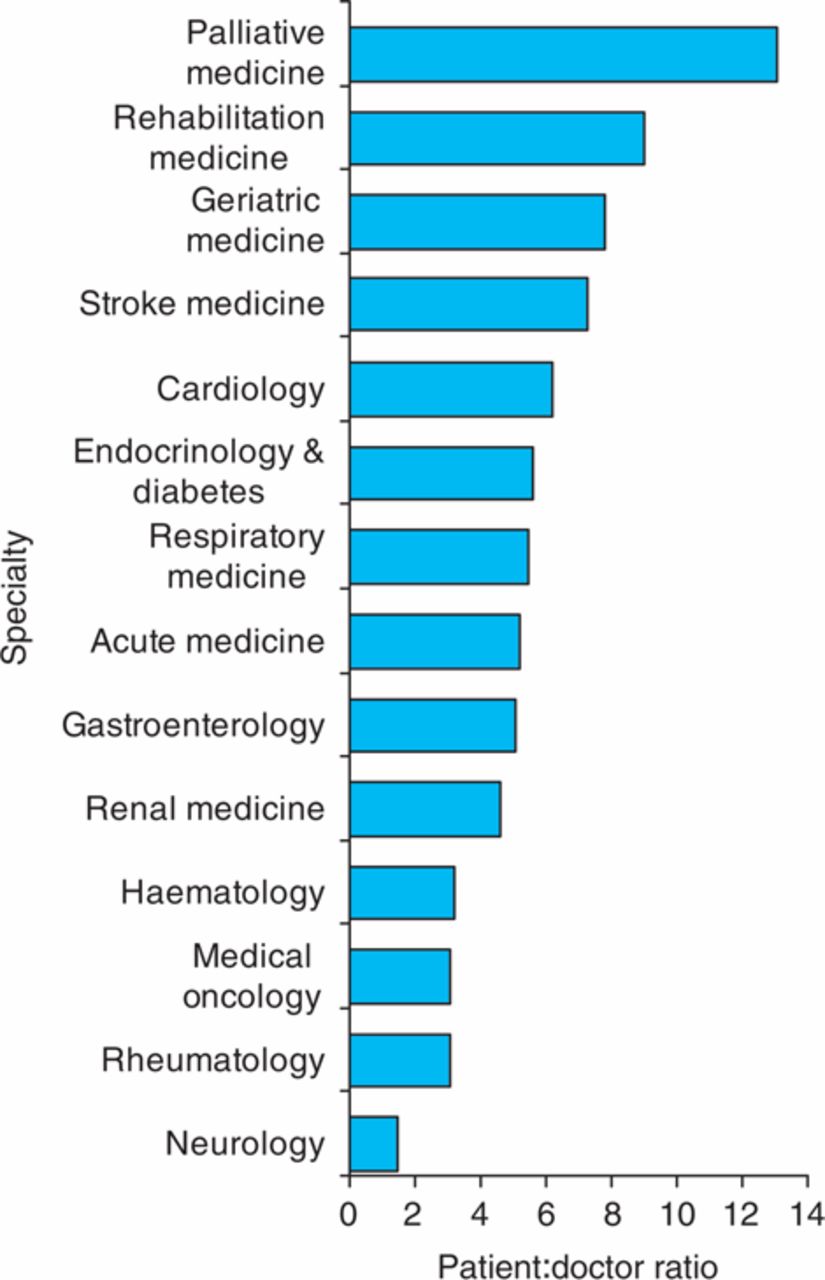
At 11 am on 5 November 2009 there were 18,854 hospital in-patients being looked after by these teams. The average number of patients looked after by each junior doctor (any grade) was five but there was a large range (1–36) (Fig 1). The average patient:doctor ratio was not related to hospital size but was lower in London than all other regions (Fig 2) and was significantly lower than in Wales and five other SHAs (p<0.005). The patient:doctor ratio varied considerably between specialties (1.5 to 13.1) (Fig 3). The average number of patients per team if all grades of junior doctor present in the hospital were included was 21 (range 1–87). When SpRs were ‘excluded’ from the analysis (as most ward teams run without them most of the week) the average number of patients looked after by each doctor was 11 (range 2–65). Sickness rates were variable between grades of junior doctor, the highest rate being in F2s with a rate of 3.5% which was significantly higher than other grades (2.2%, p<0.02) (Table 3). A large proportion of consultants (58.3%) reported an increase in sickness rates of juniors under them compared with before the EWTD was introduced. Vacancy rates varied between 1.0% for F1 posts to 8.6% for ST posts (Table 3).

Distribution of patient:doctor ratios for medical teams in England and Wales at 11 am on 5 November 2009.

Mean patient:doctor ratios by different strategic health authorities (SHAs) in England and Wales at 11 am on 5 November 2009.

Mean patient:doctor ratios by different medical specialties in England and Wales at 11 am on 5 November 2009.
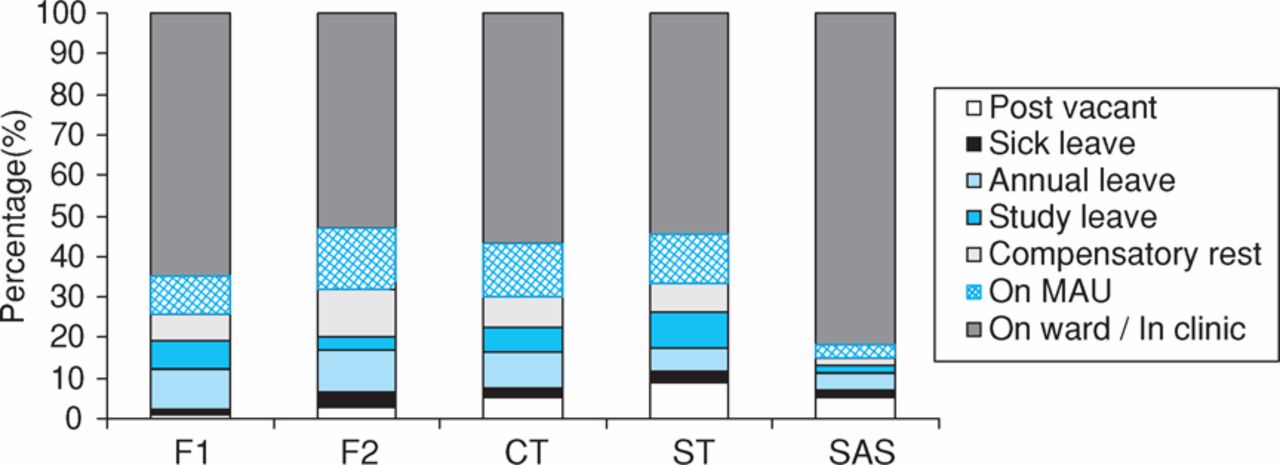
Location of physician trainees of different grades at 11 am on 5 November 2009. CT = core medical training years 1–2; F1 = foundation year 1; F2 = foundation year 2; MAU = medical admissions unit; SAS = specialty doctors and non-consultant career grade posts; ST = specialist and specialty training years 3–7.

Distribution of patient:doctor ratios for all medical teams in England and Wales at 11 pm on 5 November 2009.

Patient: doctor ratios by different regions in England and Wales at 11 pm on 5 November 2009.
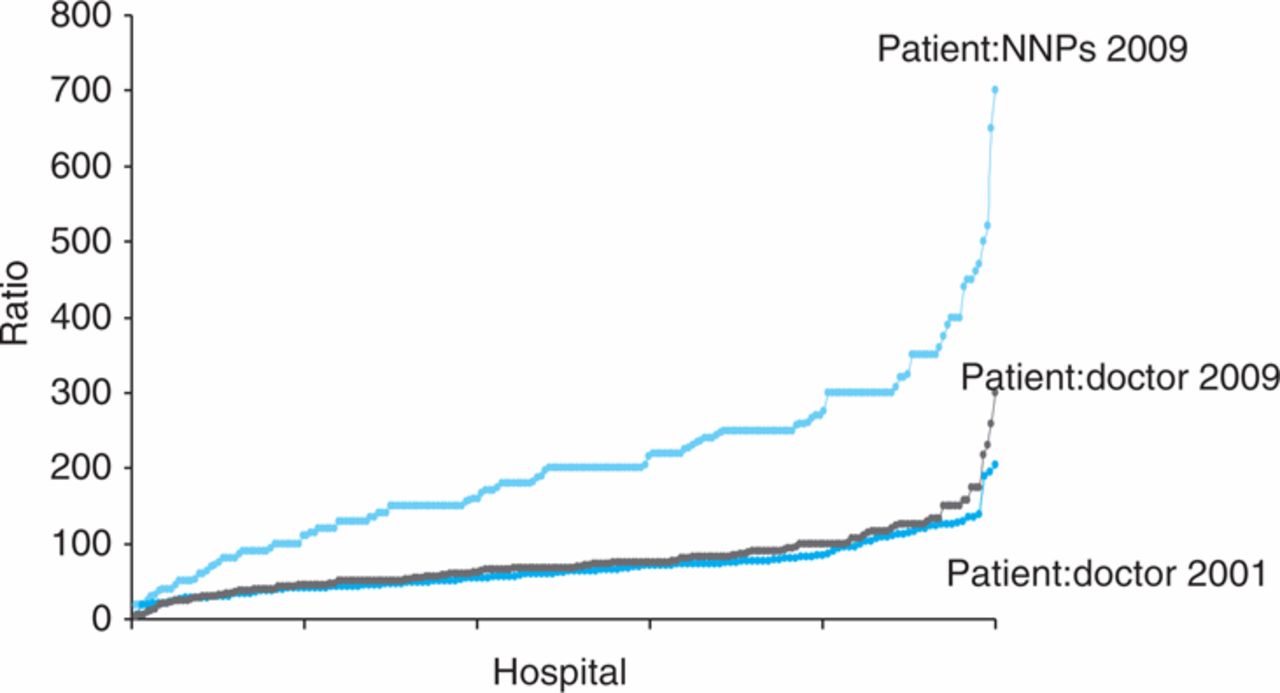
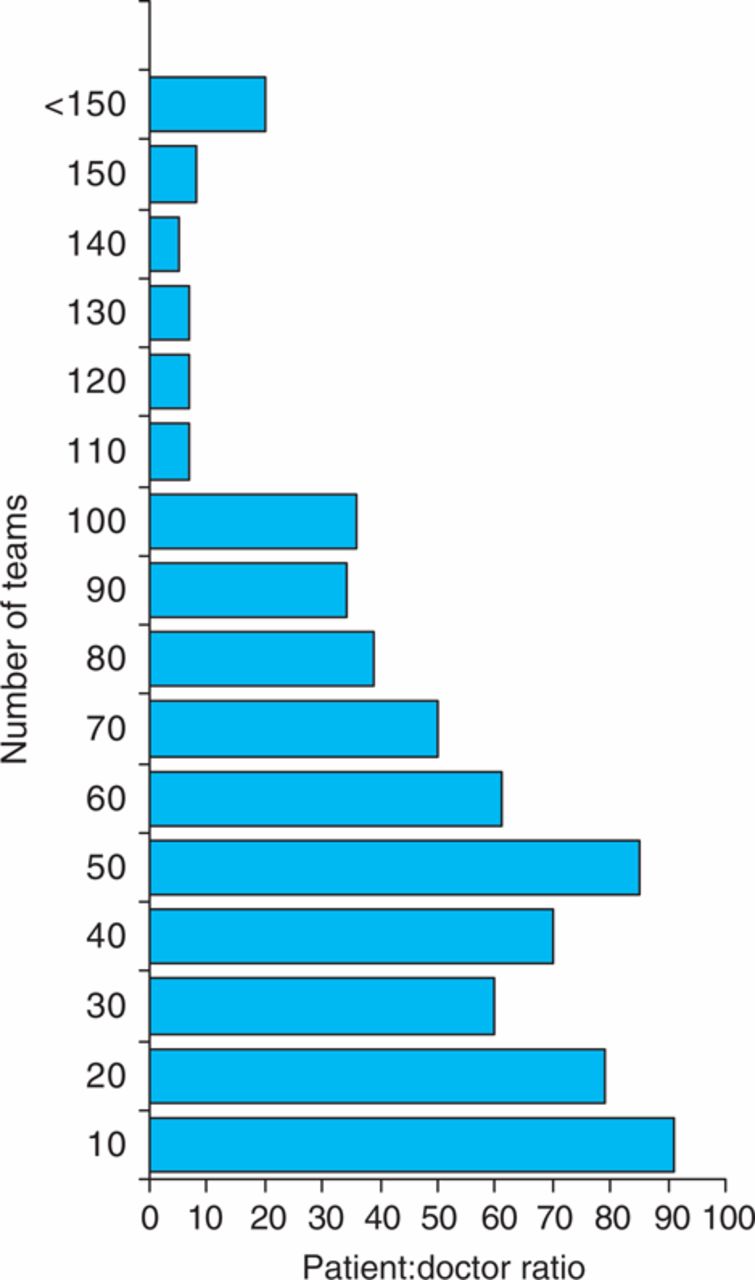
Night-time distribution of patient:doctor ratios and patient: night nurse practitioners (NNPs) ratios ranked in ascending order for all responses in 2001 and 2009.
Most senior resident physician at 11 pm on 5 November 2009. CT = core medical training years 1–2; F1 = foundation year 1; F2 = foundation year 2; SAS = specialty doctors and non-consultant career grade posts; ST = specialist and specialty training years 3–7.
Number of patients looked after by resident doctor (patient:doctor ratio) at night 2001 and 2009.
Proportion of doctors in different locations at 11 am on 5 November 2009.
The breakdown in location of doctors at 11 am is shown in Fig 4. If time spent on ward, in clinic or on the medical assessment unit is counted as ‘training time’, the average proportion of training time junior doctors had available varied from 66.9% for CTs up to 79.8% for F1s. Based on a 48-hour week this allows for a maximum number of hours training per year of 1,650–2,000. At 11 pm there were 97,561 hospital inpatients being looked after by teams caring for patients looked after by the consultants questioned. The make-up of the teams varied considerably with 29.8% of them using NNPs. The average number of patients looked after by each team was 146 (range 1–650). The average number of patients per doctor at night on these teams was 61 (range 1–400). The distribution of patient:doctor ratios showed a bi-modal peak (Fig 5). There was no difference between hospitals of different sizes, but London and Yorkshire and Humber SHAs had a lower patient:doctor ratio than other regions (Fig 6), although this was only significant when compared to East Midlands and East of England SHAs (p<0.004). There was remarkable consistency between the other regions of 57–58 patients per doctor.
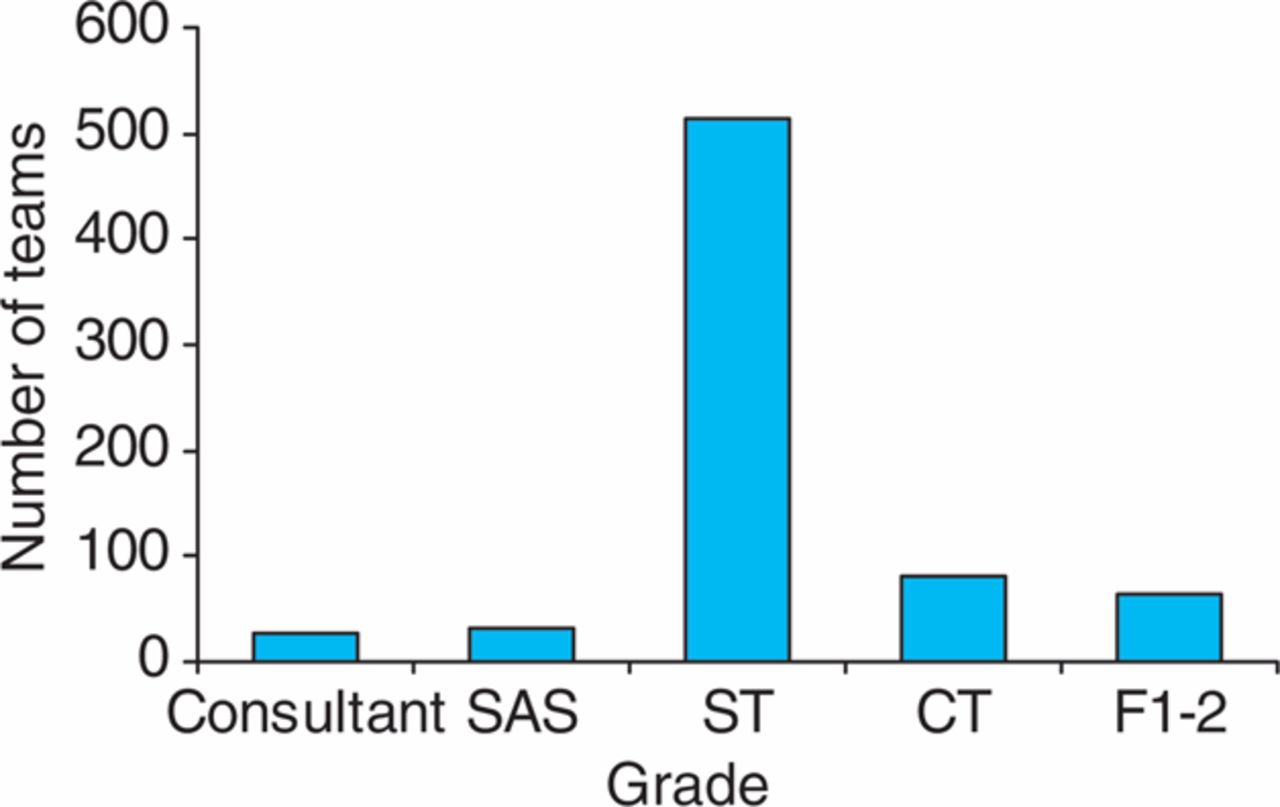
The distribution of patient:doctor ratios or patient: NNP ratios compared with 2001 is shown in Fig 7. Hospitals with Hospital at Night teams including NNPs had a lower number of patients per doctor compared to those without NNPs. The number of patients looked after by each NNP was 202 (range 18–700). The breakdown of the night teams is shown in Fig 8. Only 6.1% of teams used resident consultants and 86.9% had junior doctors as the most senior member of the team. An F1 or F2 doctor was the most senior doctor resident at night in 63 teams. The number of patients looked after by these doctors varied between 15 to 218 and these teams were spread across all regions and in hospitals of different sizes.
Discussion
This study is the largest set of data on patient:doctor ratios in the UK, as well as the first independent assessment of sickness and vacancy rates in the training grades. It reveals many interesting and some worrying issues relevant both to the training environment and patient safety. Its anonymous nature protects it from manipulation by employers but also prevents corroboration of the data directly by contacting hospitals or individual clinicians and thus is its major limitation. The distribution of responses from different SHAs was representative of the size of each SHA as were the responses from the individual medical specialties. It is unclear what the exact return rate is as a proportion of all trusts in the UK as the number of ward teams in the UK is unknown. However, the number of ST posts in England and Wales at the time of the survey was around 4,600, suggesting a response rate of around 27%.
The most significant weakness of this study is the susceptibility to reporter error, either due to incorrect data on number of patients looked after by teams (particularly at night) or misinterpretation of the questions asked. The use of multiples of 50 for some of the night-time team sizes would be consistent with this. The anonymous nature of the survey renders verification of datasets impossible. However, there is no reason to believe consultants responding to the survey would maliciously input incorrect data and the remarkable consistency of mean team size at 11 pm in many of the regions is striking.
It is reassuring that the average number of patients looked after by an individual trainee physician during normal working hours is five. However, it is concerning that some trainees are looking after up to 36 patients each. Furthermore the patient:doctor ratio of 11 for doctors below the ST grade is probably more representative of most teams looking after acute medical patients. The relatively low patient:doctor ratio seen in London compared to other regions is not surprising given the much higher number of trainee doctors in this region. For example, in 2008 there were 1,135 posts at ST3 level in the London deanery for all specialties compared with 146 in Wales.5 Arguably, it could be suggested that trainees in Wales have twice the workload of those working in London. Whether this provides a better training opportunity because of increased exposure to clinical cases or a worse one due to increased pressure is very difficult to assess objectively. However, these two regions would make good comparators for any measures of training quality that may be devised, although evidence on clinical outcomes might also be relevant.
The differences seen between individual medical specialties probably reflects the different patient case-mix of those specialties. The relatively high patient:doctor ratio for geriatric medicine though may also reflect the increasing number of admissions seen in the UK over the past few years in this patient group. Further studies assessing the training experience and intensity of work are needed. Understanding night-time working of trainee physicians is complex as many hospitals operate many different types of working, including variants of the Hospital at Night model.6 Medical patients may be looked after by many different grades of doctor or nurse from a wide background of specialty. This survey confirmed this wide variation, as shown by almost 30% of hospitals using NNPs in their teams and 6% using consultants. Despite this, it is still concerning that some doctors are responsible for very large numbers of patients at night. Furthermore, it is alarming that in a significant number of hospitals, the highest grade of doctor in the hospital in charge of medical patients is either an F1 or F2. This finding needs urgent confirmation or refutation.
Compared with the only previous study (in 2001) looking at night-time physician trainee working,4 patient:doctor ratios have remained the same (Table 2, Fig 7). Trainee numbers within medicine have increased by 66% since 20017 and this suggests that hospitals have been successful in reorganising rotas to maintain out-of-hours cover. Unfortunately there are no data to compare patient:doctor ratios during working hours. However, it seems very likely that in the need to maintain night-time hours, time spent on the ward during normal working hours will have decreased. Such daytime working in normal hours is likely to provide the best opportunity for both structured training and supervised experience.
The sickness rates of trainee physicians are significantly lower than for other healthcare professionals in the NHS, although they are higher than previous estimates for medical staff (1.08% in a recent study8). Mandatory sickness rate reporting is not required by foundation trusts in the UK and this survey is the first to get independent evidence of current rates for junior doctors. The significantly higher sickness rate in F2 doctors compared with other grades is interesting, and may reflect loss of team working and a sense of belonging in doctors a year into their career.9,10 Many foundation school rotations with medicine in the F2 year do not have medicine in the F1 year and thus ‘career physicians’ are less likely to be on these rotations, which again may impact on sickness rates. The role of the F2 grade is currently under review.
Vacancy rates reported in the survey are higher than expected, especially for the ST level. This may well be because trainees on ‘out of programme experience’ are not counted in official figures when in reality these posts are often not filled. Vacancies have both direct and indirect effects on service provision and potentially patient safety. Rota gaps are often hard to fill with locum staff and there are significant concerns as to the safety of some locum doctors.11 Having fewer doctors on the team increases the workload on other members to the detriment of both doctor and patient.
A significant concern with the introduction of the EWTD is the reduction in training time. Unfortunately there is no good evidence as to the amount of time available for training prior to the introduction of the EWTD. This study shows that sickness leave, annual leave and compensatory rest result in trainees only being available for ‘training’ for 1,650–2,000 hours a year at best. Furthermore, it seems likely that the quality of training out-of-hours will be variable due to the large differences in intensity demonstrated in this study. This study has shed new light on the working practices of trainee physicians. The findings should be considered preliminary but they urgently need to be investigated further in view of the potential effects on training and patient safety.
- © 2010 Royal College of Physicians


Jump to section
Related Articles
Cited By...
- Prospective cohort study protocol to describe the transfer of patients from intensive care units to hospital wards
- UK doctors' views on the implementation of the European Working Time Directive as applied to medical practice: a qualitative analysis
- Career choices of junior doctors: is the physician an endangered species?
- Moving towards consultant delivered care