
ABSTRACT
Introduction The UK uses the 2-week-wait (2WW) pathway for rapid access to cancer services. It is unclear whether this is effective for brain cancer.
Methods We retrospectively analysed all 2WW referrals for brain cancer between 2009 and 2016 in a district general neurology department. We compared clinical presentations to national guidelines and diagnoses of brain cancer.
Results Of the 153 cases analysed, four brain cancers were identified: two glioblastomas and two metastases. Headaches were the most common referral. The end diagnosis was mostly migraine. The highest positive predictive value was for behavioural/personality change (5.3%) and sub-acute neurological deficit (3.2%). There was no significant association between any symptom(s) and brain cancer.
Conclusion The 2WW pathway is not effective in the diagnosis of brain cancer. Resources are better directed towards clinical research and treatment trials. Headache remains the most common reason for referral although it is not yet a reliable indicator of brain cancer.
Introduction
The 2-week wait (2WW) referral system is a UK government target initiated in 2000 in response to publication of the UK's poor cancer waiting times.1,2 It promised rapid access to specialist services for patients with red flag symptoms of suspected cancer, delineated by National Institute for Care and Health Excellence (NICE) guidelines. Since its introduction, some studies have found increasing referrals via the pathway, increased routine referral waiting times and decreasing numbers of cancer diagnoses.2
Effectiveness of the pathway in primary central nervous system (CNS) tumours is less well reported, likely related to their low incidence of 17 per 100,000 per year.3 Malignancy is graded on a scale of 1 to 4 by the World Health Organization (WHO), based on invasiveness, histological and cytological characteristics, and prognosis after resection.4 Approximately two-thirds are malignant (WHO grade 3 or 4), accounting for approximately 3% of all cancer cases. Primary CNS cancer has an incidence of 5–8 cases per 100,000 per year and a 5-year survival rate of 24%.5,6 Subsequent references to CNS tumour pertain to all CNS neoplasms. CNS cancer is used to indicate WHO grade 3 and 4 tumours.
The 2005 NICE guidance specified several referral criteria to help general practitioners identify ‘red flag’ symptoms of suspected CNS cancer (supplementary material S1, Table S1), admittedly, based on limited-quality evidence.7
A 5-year study addressed computed tomography (CT) requested using the 2005 guidance and identified 17 tumours from 2,938 scans, of which, four were glioblastoma multiforme. The positive predictive value (PPV) of the guidance was 2.9%.8
The NICE guidance was updated in 2015 and recommended direct access neuroimaging for ‘progressive, sub-acute loss of central neurological function’. NICE attempted to find a ‘risk threshold’ for individual symptoms that would best predict a diagnosis of CNS cancer, based on the PPV. The 2005 NICE guidance found that across all cancers, few symptoms had a PPV of less than 5%.7 Therefore, the 2015 Guideline Development Group agreed a PPV of at least 5% would be preferable. However, to mitigate against the potential increased clinical costs and anxiety generated by referral and investigation, a threshold of 3% was adopted.9
The evidence in suspected CNS cancer revealed that no individual neurological symptom met a PPV threshold of 5%, the highest being for new onset seizures at 1.2% for all patient groups. Despite varied PPVs for different symptoms across the studies, the evidence was assessed to be of moderate to high quality. The NICE Guideline Development Group felt that, based on their clinical experience, progressive sub-acute loss of central neurological function can be a symptom of brain cancer that can be diagnosed with neuroimaging, and that the PPV for this symptom was likely to exceed 3%. Magnetic resonance imaging (MRI) of the brain was deemed superior to CT. The recommendation was made for urgent MRI of the brain for adults with progressive sub-acute loss of CNS function. It was also considered that an urgent scan instead of referral to neurology would be a faster route to neurosurgery. Despite an increase in MRI, a decrease in outpatient appointments and general practitioner (GP) consultations was predicted with an overall small decrease in costs.9,10
Several studies have examined the 2WW pathway for primary CNS tumours and cancer (Table 1). Between 0% and 9.3% of those referred by the 2WW pathway ultimately had a diagnosis of CNS cancer.11–17 This does not include patients referred with already known diagnoses.14 Adherence to NICE referral criteria was associated with greater diagnostic yield but the 2005 criteria were found to have low sensitivity (0.62%) and PPV (0.41%).11–13,15 The most common symptom precipitating referral was isolated headache.11,14,15 Yet, headaches of recent onset with features suggestive of raised intracranial pressure (ICP) were actually less frequent in patients with CNS cancer. Seizures followed by sub-acute focal symptoms had the highest PPV.15,17
Summary of previous evidence regarding the 2-week wait pathway for central nervous system tumours and malignancies
The National Cancer Intelligence Network found 17% of all brain and other CNS tumours are diagnosed via GP referral to secondary care; 61% via emergency services and 1% via the 2WW system, the lowest diagnostic yield in any cancer type.5 Of all cancers, brain cancer has the highest proportion of first attendances through the emergency services (46.2%).18
Hamilton and Kernick found that, of 3,505 patients presenting to primary care, in those diagnosed with primary brain tumour, new-onset seizures were the most predictive (PPV 1.2%) followed by weakness (0.14%), confusion (0.2%) and headache (0.09%).19
We report on 2WW referrals over 9 years to examine the predictive value of symptoms and signs of CNS cancer; examine previous and current referral criteria for diagnosing CNS cancer; and to make recommendations to optimise diagnosis and resources in the management of brain cancer.
Methods
A retrospective analysis was undertaken for adult patients accepted via the 2WW pathway for suspected CNS cancer to a district general hospital, Whipps Cross Hospital (WXH), between June 2007 and January 2016. WXH covers a population of 350,000 adults.
Patient records, including demographic details, referral pro formas and outpatient clinic letters were accessed electronically on Cerner Millennium software (Cerner UK, London, UK). Referral date and first clinic date were recorded and used to determine the interval between referral and diagnosis.
Most GPs completed brain cancer-specific referral forms based on 2005 NICE guidelines. Others wrote individual referral letters to the neurologist. Records were used to derive end diagnosis, symptomatology and neurological examination findings.
Statistical analysis
These criteria were tested for association with CNS cancer and CNS tumours using multiple logistic regression. Cases that already had a radiological diagnosis at referral were excluded, as were cases that did not have a definite final diagnosis. Individual symptoms were tested for association with CNS cancer and CNS tumours. A clustering analysis was then performed to examine for interactions between plausibly related pairs of symptoms, based on the possible anatomical and functional basis of the symptoms. Finally, symptoms were manually grouped into composite categories for analysis based on the 2005 and 2015 criteria.
The most common signs on examination were clustered into five domains: ataxia, visual field defects, hemiparesis, sensory disturbance and cranial nerve palsy.
The primary outcome was the number of primary (WHO grade 3–4) or secondary CNS cancers identified within the cohort. A secondary outcome of any CNS tumour (WHO grade 1–4) was also tested. The PPVs and negative predictive values (NPV) were calculated for referral symptoms, neurological examination findings and composite referral criteria, expressed as percentages (95% confidence interval (CI)). These variables were then tested for association with outcomes of CNS cancer or any CNS tumour, using models of multiple logistic regression. For each initial model, a stepwise backward procedure was used to remove non-significant variables and build the final model. Statistical significance was assumed with p<0.05. Data were analysed with MS Excel and SPSS. An external statistician (www.biostatcode.org) was employed for the analysis.
All data were stored on NHS computers in accordance with local data protection policies and will be kept for 10 years. In line with guidelines of the Health Research Authority (www.hra-decisiontools.org.uk/research) the work was classed as service evaluation and registered with the Clinical Effectiveness Department at Barts Health NHS Trust.
Results
Of 257 cases identified, four cases were excluded as patients were younger than 18 years at referral and one case was excluded due to missing clinical records. Seventy cases with prior imaging were removed from further analysis. Finally, 29 cases had no final diagnosis and were excluded. The final cohort comprised 153 cases (Fig 1).
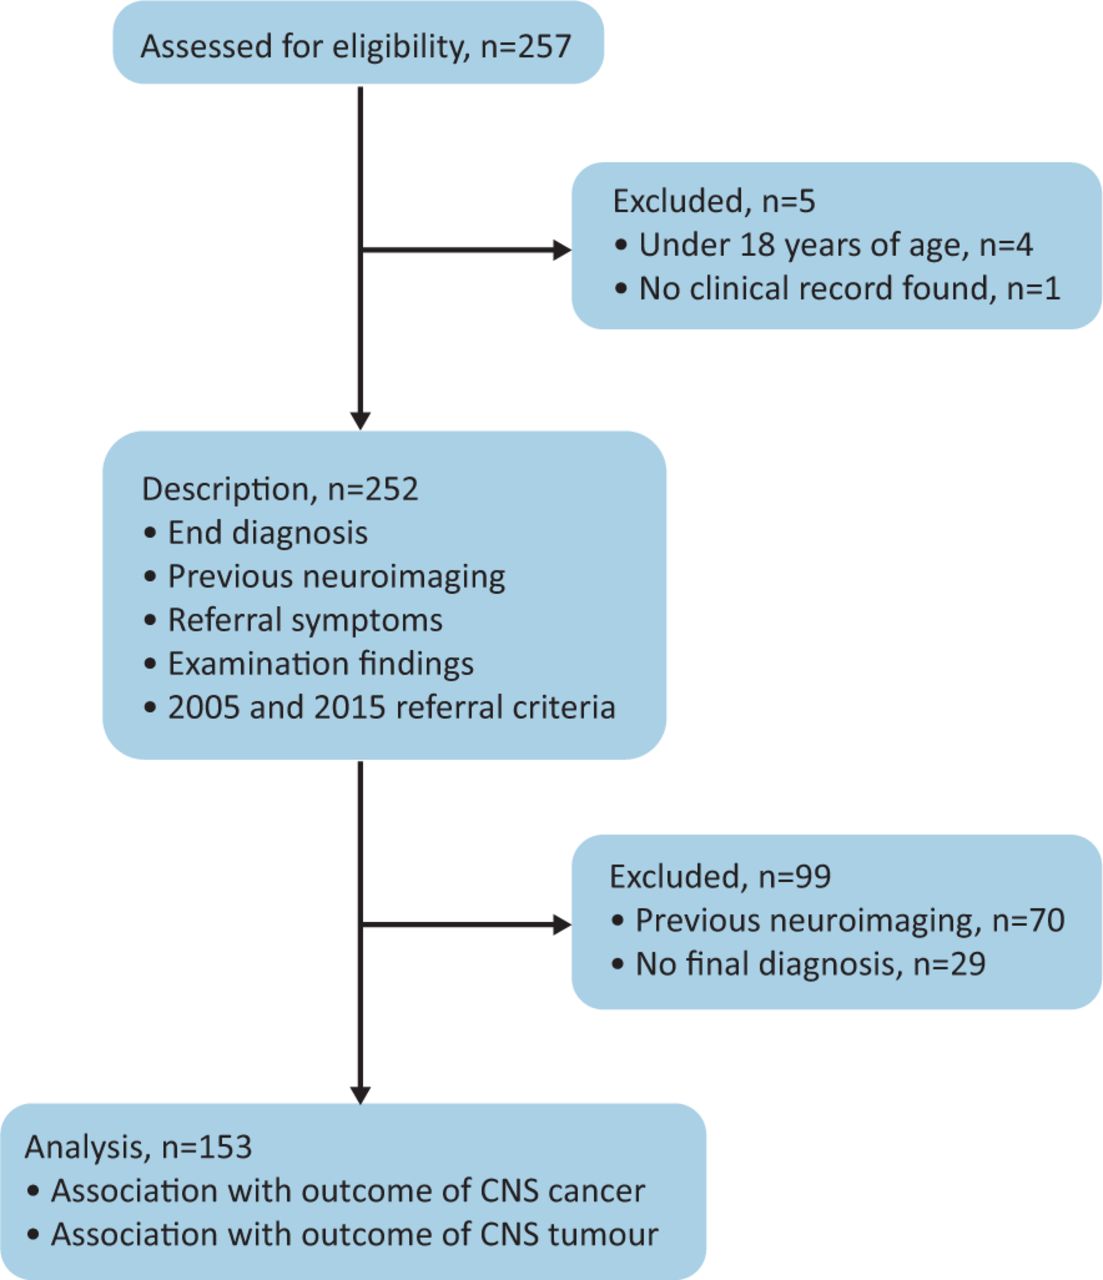
Case selection for description and analysis. CNS = central nervous system.
Of the 153 referrals analysed, 99 were women. Mean age at presentation was 49.5 years (median 48; range 20–89). One-hundred and fifteen (75.1%) patients were referred using the original London Cancer Alliance pro forma, based on NICE 2005 guidelines. Four (2.6%) cases were referred via the updated 2015 pro forma and 24 (15.6%) were referred by letter or alternative form. In 10 (6.5%) cases, the referral documentation was incomplete or missing.
Median time to be seen in clinic was 12 days, with 61.5% of patients being seen within 14 days of the referral date.
Diagnosis
The proportion of CNS cancer was low (2.6%); therefore, we also assessed the secondary endpoint of any CNS tumour (6.5%). Ten CNS tumours were identified. Four were CNS cancers: two primary CNS cancers and two cerebral metastases. Both primary cancers were glioblastoma multiforme (GBM). Of the benign tumours, four were meningiomas and two pituitary adenomas (see supplementary material S1, Table S2).
Of the non-tumour diagnoses, primary headache disorder was the most common outcome (55.6%). The most common type of headache was migraine (43.8%), followed by ‘non-specific’ headache (3.3%) and medication overuse headache (3.3%). The next most common diagnoses were cerebrovascular disease (5.2%), peripheral neuropathy (3.9%), epilepsy (3.3%), multiple sclerosis (3.3%) and Parkinson's disease (3.3%; Table 2; supplementary material S1, Table S3). The most common non-neurological diagnosis was syncope (3.3%).
End diagnosis (in order of frequency)
Individual symptoms
Headaches were the most common symptom prompting referral (62.7%). This was further subdivided into headaches with features suggestive of raised ICP (worse in the morning, lying flat, associated with nausea or vomiting, or increased on coughing or straining; 29.4%) and those without (33.3%). The next most common symptoms were visual disturbance (32.0%) and nausea and vomiting (27.5%, but not in isolation; Table 3; supplementary material S1, Table S4).
Presenting symptoms (in order of frequency) and predictive values for central nervous system cancer
We tested referring symptoms for association with CNS cancer. Several symptoms met the 3% PPV threshold for likelihood of CNS cancer, including symptoms suggestive of cranial nerve palsy (25.0% (95% CI 4.2–71.8)), gait abnormalities (11.1% (95% CI 2.0–43.7)), memory impairment (10.0% (95% CI 1.8–40.5)), sensory loss (6.7% (95% CI 1.2–29.5)), limb weakness (5.3% (95% CI 1.0–24.3)) and visual disturbance (4.1% (95% CI 1.5–10.4)). There was no statistically significant association between any individual symptoms and an outcome of CNS cancer or tumour.
Grouped symptoms
Most patients (84.3%) presented with more than one symptom (median 3; range 1–9). Therefore, an interaction analysis was performed to look for meaningful interactions between pairs of plausible clinically related symptoms, based on the neuroanatomical or functional substrate of the symptoms. No significant interactions between pairs of related symptoms and the outcomes of CNS cancer or CNS tumours were identified.
NICE criteria
Symptoms were clustered into composite groups based on the 2005 and 2015 NICE criteria: CNS symptoms; suspected seizures; subacute neurological deficit; progressive and subacute neurological deficit; behavioural or personality change or cognitive deficit; and progressive or recent-onset headaches with features of raised ICP. Of these, behavioural and personality change had the highest PPV (5.3% (95% CI 1.0–24.3)), followed by subacute neurological deficit (3.2% (95% CI 1.2–8.2)) and CNS symptoms (3.0% (95% CI 2.8–3.1); Table 4). There was no statistically significant association between these criteria and an outcome of CNS cancer or CNS tumours.
Cases manually reclassified into symptom groups based on National Institute for Health and Care Excellence 2005 and 2015 referral criteria and their association with central nervous system cancer
Examination findings
An abnormal examination was found in 38.6% of patients, 50.9% were normal, and 10.4% were not recorded or missing. The most common signs were ataxia (8.5%), sensory disturbance (5.2%), cranial nerve palsies (3.9%), visual field defects (3.9%) and hemiparesis (3.9%; Table 5). An abnormal neurological examination had a PPV of 5.1% (95% CI 4.20–6.14) for CNS cancer. Visual field defects had a PPV of 16.7% (95% CI 7.80–32.1) for CNS cancer. Similarly, cranial nerve palsies had a PPV of 16.7% (95% CI 3.15–55.17). There was no statistical association between abnormal neurological examination findings and CNS cancer. There was, however, a statistically significant association between visual field defects and an outcome of CNS tumour (odds ratio 10.39; p<0.05).
Neurological examination findings (in order of frequency) and association with central nervous system cancer
Discussion
The low yield of CNS cancer in this study is in keeping with previous evidence that up to 98.4% of all CNS tumours are diagnosed through other referral pathways and that the 2WW pathway is ineffective for the diagnosis of primary CNS cancer.5
Individual symptoms
Headache
The most common symptom prompting referral was headache, migraine being the end-diagnosis in the majority.20 Between 40%–60% of patients with brain tumour present with headache, however, it was rarely in isolation.21–23 Moreover, the prevalence of incidental brain lesions in an asymptomatic population is the same as those presenting with headache, increasing with age in both groups.24,25
In this study, symptoms suggestive of a raised ICP headache had a strong negative predictive value of CNS cancer, suggesting that, paradoxical to traditional beliefs, with such features the likelihood of CNS cancer is low. This is consistent with cohorts of patients presenting with ‘headache of raised ICP’ that have shown that neither is this higher in patients with brain tumour nor is it an indicator for raised ICP.21,23,26,27 Migraine has been shown to be more likely to occur in the early hours of the morning.28 This characteristic increases with age, 58% of sufferers in their 7th decade experience attacks during sleep and/or upon awakening.
Other neurological symptoms
Visual disturbance, sensory loss, limb weakness and memory impairment had a PPV that met the 3% threshold for referral. Progressive, subacute sensory or visual disturbance, or limb weakness would meet criteria for referral for neuroimaging under current 2015 NICE guidance. Rapid, progressive memory loss was a criterion in the 2005 guidance but was subsequently removed.7 It is possible that the low total number of cases of memory impairment led to the overestimation of its predictive value. Similarly, symptoms suggestive of a cranial nerve palsy and gait abnormalities both had a PPV >3%, but there was no statistical association between these symptoms and CNS cancer. Thus, despite several individual symptoms in this cohort having a PPV higher than the 2015 risk threshold, none could statistically predict an outcome of CNS cancer. Previous studies have shown seizures to be strongly predictive.17,19 In our cohort, seizures had a poor PPV for CNS cancer, but most seizures present through the emergency services and those through primary care are referred to the first-fit clinic.
Grouped symptoms
Current NICE guidelines acknowledge there is insufficient evidence to find any symptom(s) that would meet the risk threshold of a PPV of 3%. We did not find any meaningful symptom clusters that may have predictive values for CNS malignancies.
Reclassifying cases by the 2005 and 2015 NICE criteria, we failed to find any statistical association between these groups and CNS cancer. This corroborates evidence from the guidelines groups themselves and provides further weight to the argument that the guidelines do not provide any meaningful diagnostic criteria to inform GPs on how to make appropriate referrals. Interestingly, the criterion with the highest PPV (5.3%) was ‘behavioural and cognitive symptoms’ that encompassed cognitive impairment, behavioural disturbance and personality change. This is not featured in 2015 guidance.7
The next most predictive criteria were ‘symptoms related to the CNS’ (3%), followed by ‘subacute focal neurological deficit’ (3%). The former was clearly a large heterogeneous group that included most referrals and identified all CNS cancers. The criterion of subacute focal deficit was adopted as the single referral criterion in the 2015 guidance, although based on weak evidence.
Examination findings
An abnormal neurological exam showed no positive association with CNS cancer. However, a normal examination had an NPV of 100%. This may suggest that, in a low-risk patient group, a normal neurological examination may provide reassurance about CNS cancer and prevent an unnecessary referral. In the outpatient setting, a normal neurological examination has an excellent NPV in excluding brain tumours. In primary care it is less clear, with many brain tumours and other intracranial disorders having a normal examination. This may reflect the difficulties with GPs confidently identifying neurological signs or conducting a thorough examination in the short time allocated.
While the most common findings of ataxia, visual field defects, sensory disturbance and hemiparesis could all plausibly suggest a space-occupying lesion in the CNS; none of these groups were significantly associated with CNS cancer. An association between visual field defects and CNS tumours was found, largely driven by the association between bitemporal hemianopia and pituitary tumours.
Of referrals, 10.4% had no documented neurological examination. The predictive value of examination findings might be improved by more reliable documentation. The importance of this is that GPs and other non-specialists are not confident in their neurological examination, through lack of adequate neurology exposure in undergraduate and postgraduate training. The phenomenon of ‘neurophobia’ is well-documented in students and non-specialists. While no direct evidence on the impact of neurology education in primary care is available, studies have shown that confident examination skills in both the emergency department (ED) and community setting improve diagnostic accuracy and aid decision making. Various frameworks have been proposed towards this goal.29,30 The COVID-19 pandemic has severely curbed face-to-face consultations. However, it has also created opportunities for innovative ways of working with the use of video assessments and fundus photography. The challenge remains to be able to embed this practice beyond the pandemic.
Role of direct access imaging
To date, direct access imaging has not been shown to increase the identification of brain cancer; its main role has been a cost-saving measure in preventing referral to secondary care and reassuring the patient.31,32 However, approximately one-third of patients with neuroimaging are still referred onward to secondary care, in line with previous studies.8
Clinical presentation prompting imaging and patient pressure are unlikely to change.33 Until the headache classification is better defined, it is likely that the most common reason for imaging will be for headache. This is even though it has been shown that longer-term reassurance is not maintained in those with comorbid mood and anxiety disorders. More pertinent will be the outcome of incidental findings. Between 6%–10% of asymptomatic individuals have abnormal findings on imaging. About 1%–2% have lesions which may need further monitoring or intervention.25,34 This is no different in patients with headache outside the context of thunderclap headache.24,25 Yet, nevertheless, the tendency to intervene occurs. This is clear from a meta-analysis showing imaging abnormalities in headache patients similar to previous studies, prompting the authors to recommend imaging for headache.35 Yet the authors did not acknowledge that the results were similar to those in imaging ‘normals’. The economic impact and clinical governance of safely addressing incidental lesions has not been accommodated in any cost analyses. This is likely to require additional unplanned secondary care resources and be prone to individual preferences in management.
For the clinician, reassurance from imaging can also be misplaced. Most headache alone will not be indicative of additional pathology and the data that exist do not support screening. The natural history of the most common headaches (migraine and tension-type headache) is improvement over time.36 But, until then, there remain decades of potential headache recurrence. Patient and clinician tendencies are likely to dictate whether future re-investigation and use of healthcare resources (whether elective or emergency) is repeatedly accessed and whether the context for doing so is appropriate.33,37
The gravity of the diagnosis and politics continues to maintain a pathway with such a low diagnostic yield; to date, its clinical and economic value has not been justified.
Limitations
This study included 153 patients, a relatively low number compared with the amount of referrals nationally. However, it remains the second largest cohort compared with those previously published, and its findings are in line with previous evidence. It is noted that in the 9-year study period, only 257 referrals were made to the WXH neurology service. Some referrals were rejected as they were deemed inappropriate and not in keeping with NICE guidance. This may not be representative of the volume of referrals received in other parts of the UK and, therefore, may limit the generalisability of our study. However, a larger study of 393 referrals had a similar diagnostic yield (3.1% compared with our 2.6%), so we have no reason to believe that higher volumes of referrals lead to increased diagnostic yield.17 The study period also only extended up to 2016 and, in the last 5 years, there has likely been wider uptake of the direct access to imaging pathway. Future work will be to examine the diagnostic yield of the pathway before and after the introduction of the direct access to imaging, including the burden of incidental findings and the health economic impact of a neurologist making an alternative diagnosis versus imaging alone.
Conclusion and recommendations
The observations in this study support previous evidence that the 2WW pathway for CNS cancer demonstrates low diagnostic utility.12–15,17 Furthermore, it has not been shown to improve survival outcomes and may be in fact be counterproductive.5 Most CNS cancers are diagnosed via the ED; these patients have worse short-term survival. Although the assumption is that the diagnosis has been missed prior to the emergency presentation, the rapidity of tumour growth may dictate the mode of presentation. Resources could be diverted to the ED (where the majority of CNS cancers are diagnosed) and to palliative care. Current treatments provide modest survival benefits; the key to improving outcomes will be development of effective treatment regimens. A 2020 Cochrane review found no good quality studies regarding reductions in time to diagnosis of brain tumour, or cost information about existing initiatives.38 This calls for multicentre prospective collection of clinical data and costs to inform clinicians, patients and healthcare planners how to revise the pathway to serve the purpose for which it was developed.
Summary
Supplementary material
Additional supplementary material may be found in the online version of this article at www.rcpjournals.org/clinmedicine:
S1 – Tables detailing NICE 2005 schematic, CNS tumours, end diagnosis and presenting symptoms.
Acknowledgements
Thanks to Dr Magdalena Murawska for her contribution to statistical analysis and Dr Evgenios Dimakopoulos for his contribution to data collection.
- © Royal College of Physicians 2021. All rights reserved.


