Adiposity and risk of decline in glomerular filtration rate: meta-analysis of individual participant data in a global consortium
BMJ 2019; 364 doi: https://doi.org/10.1136/bmj.k5301 (Published 10 January 2019) Cite this as: BMJ 2019;364:k5301
- Alex R Chang, assistant professor1,
- Morgan E Grams, associate professor2,
- Shoshana H Ballew, assistant scientist2,
- Henk Bilo, professor3,
- Adolfo Correa, professor4,
- Marie Evans, nephrologist5,
- Orlando M Gutierrez, professor6 7,
- Farhad Hosseinpanah, associate professor8,
- Kunitoshi Iseki, director9 10,
- Timothy Kenealy, associate professor11,
- Barbara Klein, professor12,
- Florian Kronenberg, professor13,
- Brian J Lee, nephrologist14,
- Yuanying Li, researcher15,
- Katsuyuki Miura, professor16,
- Sankar D Navaneethan, associate professor17,
- Paul J Roderick, professor18,
- Jose M Valdivielso, principal investigator19,
- Frank L J Visseren, professor20,
- Luxia Zhang, professor21,
- Ron T Gansevoort, professor22,
- Stein I Hallan, professor23 24,
- Andrew S Levey, professor25,
- Kunihiro Matsushita, associate professor2,
- Varda Shalev, director26,
- Mark Woodward, professor2 27 28
- on behalf of the CKD Prognosis Consortium (CKD-PC)
- 1Kidney Health Research Institute, and Department of Epidemiology and Health Services Research, Geisinger Health System, Danville, PA, USA
- 2Department of Epidemiology, Johns Hopkins Bloomberg School of Public Health, Baltimore, MD, USA
- 3Diabetes Centre, Isala, and Department of Internal Medicine, University of Groningen, University Medical Center Groningen, Groningen, Netherlands
- 4Department of Medicine, University of Mississippi Medical Center, Jackson, MS, USA
- 5Division of Renal Medicine, CLINTEC, Karolinska Institutet, Stockholm, Sweden and Swedish Renal Registry, Jönköping, Sweden
- 6Division of Nephrology, Department of Medicine, University of Alabama at Birmingham, Birmingham, AL, USA
- 7Department of Epidemiology, University of Alabama at Birmingham, Birmingham, AL, USA
- 8Obesity Research Center, Research Institute for Endocrine Sciences, Shahid Beheshti University of Medical Sciences, Tehran, Iran
- 9Dialysis Unit, University of the Ryukyus Hospital, Nishihara, Japan
- 10Yuuaikai Tomishiro Central Hospital, Tomigusuku, Okinawa, Japan
- 11Departments of Medicine and General Practice & Primary Health Care, School of Population Health, University of Auckland, Auckland, New Zealand
- 12Department of Ophthalmology and Visual Sciences, School of Medicine and Public Health, University of Wisconsin, Madison, WI, USA
- 13Division of Genetic Epidemiology, Department of Medical Genetics, Molecular and Clinical Pharmacology, Medical University of Innsbruck, Innsbruck, Austria
- 14Kaiser Permanente, Hawaii Region, Moanalua Medical Center, Honolulu, HI, USA
- 15Department of Public Health, Fujita Health University School of Medicine, Aichi, Japan
- 16Department of Public Health, Shiga University of Medical Science, Otsu, Japan
- 17Section of Nephrology, Baylor College of Medicine, Houston, TX, USA
- 18Primary Care and Population Sciences, Faculty of Medicine, University of Southampton, Southampton, UK
- 19Vascular and Renal Translational Research Group, REDinREN del ISCIII, IRBLleida, Lleida, Spain
- 20Department of Vascular Medicine, University Medical Center Utrecht, Utrecht, Netherlands
- 21Peking University Institute of Nephrology, Division of Nephrology, Peking University First Hospital, Beijing, China
- 22Department of Nephrology, University Medical Center Groningen, University of Groningen, Groningen, Netherlands
- 23Department of Cancer Research and Molecular Medicine, Faculty of Medicine, Norwegian University of Science Technology, Trondheim, Norway
- 24Division of Nephrology, Department of Medicine, St Olav University Hospital, Trondheim, Norway
- 25Division of Nephrology at Tufts Medical Center, Boston, MA, USA
- 26Medical Division, Maccabi Healthcare Services, and Sackler Faculty of Medicine, Tel Aviv University, Tel Aviv, Israel
- 27George Institute for Global Health, University of Oxford, Oxford, UK
- 28George Institute for Global Health, University of New South Wales, Sydney, Australia
- Correspondence to: M E Grams, Chronic Kidney Disease Prognosis Consortium Data Coordinating Center, 2024 E Monument Street, Baltimore, MD 21205, USA ckdpc{at}jhmi.edu
- Accepted 7 November 2018
Abstract
Objective To evaluate the associations between adiposity measures (body mass index, waist circumference, and waist-to-height ratio) with decline in glomerular filtration rate (GFR) and with all cause mortality.
Design Individual participant data meta-analysis.
Setting Cohorts from 40 countries with data collected between 1970 and 2017.
Participants Adults in 39 general population cohorts (n=5 459 014), of which 21 (n=594 496) had data on waist circumference; six cohorts with high cardiovascular risk (n=84 417); and 18 cohorts with chronic kidney disease (n=91 607).
Main outcome measures GFR decline (estimated GFR decline ≥40%, initiation of kidney replacement therapy or estimated GFR <10 mL/min/1.73 m2) and all cause mortality.
Results Over a mean follow-up of eight years, 246 607 (5.6%) individuals in the general population cohorts had GFR decline (18 118 (0.4%) end stage kidney disease events) and 782 329 (14.7%) died. Adjusting for age, sex, race, and current smoking, the hazard ratios for GFR decline comparing body mass indices 30, 35, and 40 with body mass index 25 were 1.18 (95% confidence interval 1.09 to 1.27), 1.69 (1.51 to 1.89), and 2.02 (1.80 to 2.27), respectively. Results were similar in all subgroups of estimated GFR. Associations weakened after adjustment for additional comorbidities, with respective hazard ratios of 1.03 (0.95 to 1.11), 1.28 (1.14 to 1.44), and 1.46 (1.28 to 1.67). The association between body mass index and death was J shaped, with the lowest risk at body mass index of 25. In the cohorts with high cardiovascular risk and chronic kidney disease (mean follow-up of six and four years, respectively), risk associations between higher body mass index and GFR decline were weaker than in the general population, and the association between body mass index and death was also J shaped, with the lowest risk between body mass index 25 and 30. In all cohort types, associations between higher waist circumference and higher waist-to-height ratio with GFR decline were similar to that of body mass index; however, increased risk of death was not associated with lower waist circumference or waist-to-height ratio, as was seen with body mass index.
Conclusions Elevated body mass index, waist circumference, and waist-to-height ratio are independent risk factors for GFR decline and death in individuals who have normal or reduced levels of estimated GFR.
Introduction
The prevalence of obesity has risen over the past half century, accompanied by increases in the prevalence of hypertension and diabetes.12 Many posit that obesity also heightens the risk for chronic kidney disease (CKD) through adverse effects on blood pressure, insulin resistance, inflammation, and dyslipidaemia, or even directly by altering systemic and glomerular haemodynamics.3 CKD is a costly condition, both from the treatment of kidney related processes and from the high associated risks of cardiovascular disease and mortality.4 Thus, understanding the relation and mediators between obesity and kidney disease is critical to inform public health efforts.
Several population based studies have found obesity to be a risk factor for CKD and end stage kidney disease (ESKD), although risk estimates have varied considerably between studies.5678910 The disparate findings could relate to differences in population demographics, study era, length of follow-up, statistical adjustment for comorbid conditions, or the definition of ESKD. In addition, the relation between obesity and risk of death remains uncertain in patients with CKD,1112131415 who face increased risk of malnutrition and muscle wasting, potentially limiting the use of body mass index to estimate risk. Other anthropometric measures, such as waist circumference or waist-to-height ratio, could be better prognostic measures in select populations.11121316
We conducted a global, collaborative meta-analysis of more than five million individuals in 63 cohorts to determine the relation between measures of adiposity and the risk of GFR decline and death, and to explore consistency in associations across cohorts.
Methods
Study design and data sources
The Chronic Kidney Disease Prognosis Consortium (CKD-PC) was established initially in 2009 (after the conference on Kidney Disease: Improving Global Outcomes Controversies) to provide data to support the definition and staging of CKD. It now includes more than 70 cohorts spanning over 40 countries with data on estimated GFR (eGFR) and clinical outcomes.17 Periodically, collaborators are invited to vote on topics for research in successive phases; the current work is part of the fourth such phase. We invited cohorts with follow-up data for ESKD, eGFR decline, and mortality to participate in this study. We categorised cohorts as general population, high cardiovascular risk (that is, participants with at least one cardiovascular risk factor), or CKD. Because selection into these three cohorts differed, we conducted separate meta-analyses for each.
A total of 39 general population, six high cardiovascular risk, and 18 CKD cohorts, collecting data between 1970 and 2017, agreed to participate and provided data for this study. We restricted analyses to participants aged 18 years and older, with data on eGFR, and body mass index. We excluded individuals with history of ESKD and those who were underweight (body mass index <18.5), because our objective was to study the association between overweight or obesity and GFR decline. For the GFR decline outcome, we excluded individuals without repeated measurements of serum creatinine. In the general population cohorts, waist circumference and waist-to-height ratio were available in 21 cohorts (n=594 496). Waist circumference and waist-to-height ratio were available in three high cardiovascular risk and six CKD cohorts. The Johns Hopkins Bloomberg School of Public Health institutional review board approved the study.
Exposures and other clinical variables
We measured body mass index by dividing weight by height squared (kg/m2), and waist-to-height ratio by dividing waist circumference by height (cm/cm). We used serum creatinine values to estimate GFR with the Chronic Kidney Disease Epidemiology Collaboration equation.18 Albuminuria was assessed as the urine albumin:creatinine ratio (ACR), but if not available, we substituted other measures (eAppendix 1). Age, sex, and race or ethnicity were self reported. Diabetes was defined by a fasting glucose concentration of 7.0 mmol/L or more, non-fasting glucose concentration of 11.10 mmol/L or more, haemoglobin A1c level of 6.5% or more, self reported diabetes, or use of glucose-lowering drugs. We defined hypertension as systolic blood pressure of 140 mm Hg or more, diastolic blood pressure of 90 mm Hg or more, or use of antihypertensive drugs; or we based the definition on administrative data codes.19 History of cardiovascular disease was defined by history of myocardial infarction, coronary revascularisation, stroke, or heart failure.
Outcomes
The prespecified primary outcome was GFR decline, which included 40% eGFR decline, eGFR <10 mL/min/1.73 m2, or ESKD (initiation of kidney replacement therapy), whichever occurred first. Prespecified secondary outcomes included ESKD alone and all cause mortality.
Statistical analysis
We used a two stage analytical approach, whereby each study was analysed separately, allowing for an examination of outliers and bias, and then meta-analysed by random effects models. Most participating cohorts in the CKD-PC transferred individual level participant data to the data coordinating centre at Johns Hopkins University. Cohorts that could not transfer data owing to legal or other logistical reasons were sent standardised code. Summary statistics were then returned to the data coordinating center for examination and meta-analysis.
As an exposure, body mass index was modelled continuously by linear splines with knots at body mass indices of 20, 25, 30, and 35. Waist circumference and waist-to-height ratio were also modelled continuously by linear splines with knots corresponding to those for body mass index (eFigure 1). Because the thresholds of waist circumference used to assess health risks are different by sex,20 we used sex specific references.
Hazard ratios and 95% confidence intervals were obtained from Cox regression models adjusted for age, sex, current smoking, and black versus other races. We also prespecified tests for effect modification with body mass index in general population cohorts, including interaction terms for age (< or ≥65 years), sex, black race, baseline hypertension, diabetes, eGFR (<30, 30-59, 60-89, and ≥90 mL/min/1.73 m2), and albuminuria (ACR <30, 30-299, and ≥300 mg/g). We quantified heterogeneity in meta-analysis using the I2 statistic, and conducted meta-regressions to examine whether length of follow-up time or calendar year of study explained heterogeneity. Because some studies have found that cardiometabolic risks associated with body mass index occur at lower values for Asians,21 we also meta-analysed cohorts from Asian and non-Asian countries separately.
We conducted several sensitivity analyses. To address the possibility of bias from reverse causation, or the possibility that non-obese participants had lost weight owing to a condition that also affected risk of eGFR decline, we conducted analyses excluding the first three years of follow-up.922 To assess the independent effect of body mass index over other known risk factors, we also adjusted for systolic blood pressure, baseline eGFR, total cholesterol, diabetes, and history of cardiovascular disease, which could be regarded as mediators in the causal pathway. Lastly, we accounted for competing risk of death using Fine and Gray models.23 We considered P<0.05 to be statistically significant for all analyses using Stata SE 14.2.
Patient and public involvement
No patients were involved in determining the research question, outcome measures, or study design. There are no plans to involve patients in the dissemination of research findings.
Results
Study characteristics
The study included 5 459 014 participants in 39 general population cohorts, 84 417 participants in six high cardiovascular risk cohorts, and 91 607 participants in 18 CKD cohorts (table 1; eTable 1). Overall, participants in higher categories of body mass index were more often of black race, more likely to have hypertension, diabetes, and albuminuria, and less likely to be current smokers (eTables 2-5). Cardiometabolic risk factors were more similar across body mass index categories in the high cardiovascular risk and CKD cohorts than general population cohorts. For instance, the difference in mean systolic blood pressure between individuals with body mass indices 35 and 18-24.9 was at least 12 mm Hg in most general population cohorts, whereas the corresponding difference in most high cardiovascular risk and CKD cohorts was less than 6 mm Hg.
Baseline characteristics of participating study cohorts. Data are mean (standard deviation) or number (%) of individuals
Number of events
In the 39 general population cohorts, mean follow-up was eight years (range 6-35), with 246 607 (5.6%) GFR decline events, 18 118 ESKD events (0.4%), and 782 329 (14.7%) deaths (eTable 1). In the six high cardiovascular risk cohorts, mean follow-up was six (2-12) years, with 3344 (6.0%) GFR decline events, 1684 ESKD (2.0%) events, and 14 646 (17.3%) deaths. In the 18 CKD cohorts, mean follow-up was four (2-16) years, with 10 680 (13.6%) GFR decline events, 8942 ESKD (9.8%) events, and 17 322 (18.9%) deaths.
Body mass index and risk of GFR decline in general population cohorts
Higher body mass index (>25) was associated with increased risk of GFR decline in general population cohorts (fig 1). Compared with a body mass index of 25, hazard ratios for body mass indices 30, 35, and 40 were 1.18 (95% confidence interval 1.09 to 1.27), 1.69 (1.51 to 1.89), and 2.02 (1.80 to 2.27), respectively, after adjusting for age, sex, race, and smoking. Lower body mass index (<25) had no association with the risk of GFR decline; the hazard ratio for body mass index 20 versus 25 was 0.92 (0.79 to 1.07). Figure 2 shows hazard ratios for GFR decline at body mass index value of 35 versus 25 for each general population cohort, showing considerable heterogeneity, which was not explained by cohort follow-up time (P=0.43 from meta-regression) or median cohort baseline year (P=0.72 from meta-regression; eFigure 2).

Association between body mass index and risk of decline in glomerular filtration rate in general population cohorts, as shown by meta-analysed hazard ratios and 95% confidence intervals related to body mass index. Association is modelled by linear splines with knots at body mass indices 20, 25, 30, and 35. Circles indicate points with significant differences in risk from the reference point at body mass index 25

Association between body mass index and risk of decline in glomerular filtration rate in general population cohorts, as shown by hazard ratios in individual studies at body mass index 35 versus 25, sorted by average follow-up time (shortest to longest). Study acronyms/abbreviations are listed in eAppendix 2 in the supplementary materials
Results were similar in sensitivity analyses excluding the first three years of follow-up, using ESKD as the sole outcome, and accounting for the competing risk of death (eFigures 3A-C). Additional adjustment for systolic blood pressure, eGFR, diabetes, total cholesterol, and history of cardiovascular disease attenuated the GFR decline risk associated with higher body mass index, compared with the main model (eFigure 3D). Compared with a body mass index of 25, adjusted hazard ratios for body mass indices 30, 35, and 40 were 1.03 (95% confidence interval 0.95 to 1.11), 1.28 (1.14 to 1.44), and 1.46 (1.28 to 1.67), respectively.
Subgroup analyses in general population cohorts
A higher body mass index was associated with an increased risk of GFR decline among all subgroups of eGFR, although risk tended to increase at body mass index of about 30 for eGFR lower than 30 mL/min/1.73 m2 (fig 3). In models stratified by baseline eGFR, hazard ratios for body mass index 35 versus 25 for eGFR categories of 90 or more, 60-89, 30-59, and less than 30 mL/min/1.73 m2 were 1.71 (95% confidence interval 1.45 to 2.02), 1.88 (1.69 to 2.08), 1.78 (1.36 to 2.34), and 1.88 (1.61 to 2.18), respectively (all P≥0.1 for interaction). Body mass index less than 25 was associated with increased risk of GFR decline in the eGFR subgroups with less than 60 mL/min/1.73 m2, but not in those with higher eGFR levels.

Body mass index interactions with risk of decline in glomerular filtration rate in general population cohorts, by estimated GFR (eGFR) category, sex, diabetes status, and Asian ethnicity. Meta-analysed hazard ratios and 95% confidence intervals are related to body mass index, modelled by linear splines with knots at body mass indices of 20, 25, 30, and 35 (reference is body mass index 25 in each category)
The risk associations between body mass index and GFR decline were generally similar in subgroups, with some exceptions. Body mass index lower than 25 was associated with increased risk of GFR decline only for men, individuals with diabetes, and individuals with an ACR of at least 300 mg/g. The risk gradient of GFR decline associated with higher body mass index was steeper in Asian cohorts than in non-Asian cohorts, and more shallow in individuals with hypertension, diabetes, or ACR of at least 300 mg/g than in individuals without those conditions (fig 3, eFigure 4).
Body mass index and risk of GFR decline in high cardiovascular risk cohorts
In cohorts with high cardiovascular risk cohorts, body mass index was not significantly associated with the risk of GFR decline (fig 4), although there was significant heterogeneity (fig 5). After excluding the first three years of follow-up, higher body mass index was associated with increased risk of GFR decline in the remaining 21 212 participants, with a hazard ratio for body mass index 35 versus 25 of 1.46 (95% confidence interval 1.06 to 2.02; eFigure 5A). Results using ESKD as the outcome, accounting for the competing risk of death and adjusting for potential mediators, were similar to those of the primary analysis (eFigures 5B-D).

Association of body mass index with risk of decline in glomerular filtration rate in high cardiovascular risk cohorts, as shown by meta-analysed hazard ratios and 95% confidence intervals related to body mass index, modelled by linear splines with knots at body mass indices 20, 25, 30, and 35. Circles indicate points with significant differences in risk from the reference point at body mass index 25
Association of body mass index with risk of decline in glomerular filtration rate in high cardiovascular risk cohorts, as shown by hazard ratios in individual studies at body mass index 35 versus 25, sorted by average follow-up time (shortest to longest). Study acronyms/abbreviations are listed in eAppendix 2 in the supplementary materials
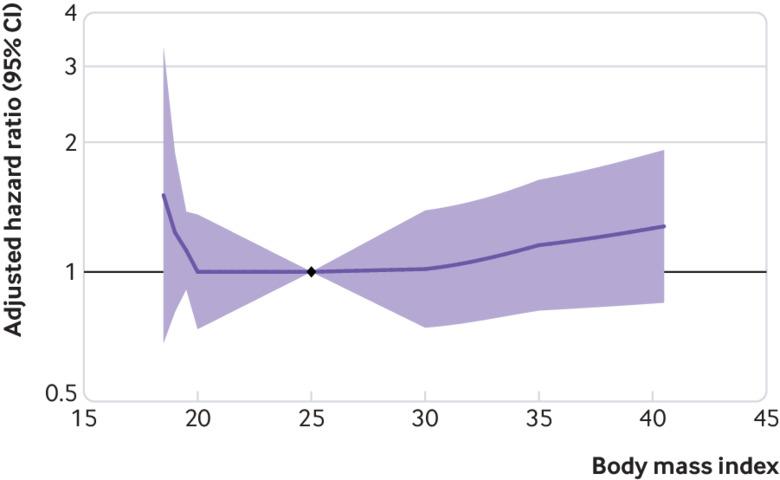
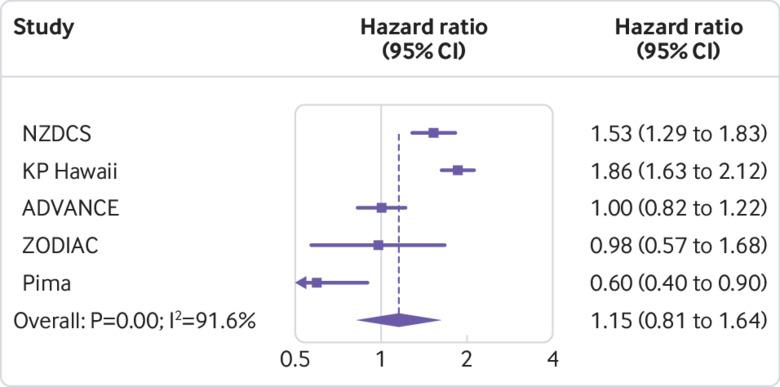
Body mass index and risk of GFR decline in CKD cohorts
Cohorts with CKD had a J shaped association between body mass index and risk of GFR decline (fig 6), but there was significant heterogeneity in risk estimates (fig 7). Compared with body mass index at 25, the hazard ratio of GFR decline risk for body mass indices 35 and 20 were 1.17 (95% confidence interval 1.04 to 1.31) and 1.25 (1.07 to 1.46), respectively. After excluding the first three years of follow-up, the association between higher body mass index and risk of GFR decline was magnified among the 19 477 remaining participants (body mass index 35 v 25, hazard ratio 1.75, 95% confidence interval 1.30 to 2.37), whereas the association between low body mass index and risk of GFR decline was no longer significant (body mass index 20 v 25, 0.88, 0.53 to 1.46; eFigure 6A). In sensitivity analyses using ESKD as the outcome, findings were similar to the primary analysis (eFigure 6B). Associations between higher body mass index and risk of GFR decline were attenuated after accounting for competing risk of death, or after adjusting for potential mediators (body mass index 35 v 25, 1.04, 0.93 to 1.18; eFigures 6C-D).

Association of body mass index with risk of decline in glomerular filtration rate in cohorts with chronic kidney disease, as shown by meta-analysed hazard ratios and 95% confidence interval related to body mass index, modelled by linear splines with knots at body mass indices 20, 25, 30, and 35. Circles indicate points with significant differences in risk from the reference point at body mass index 25

Association of body mass index with risk of decline in glomerular filtration rate in cohorts with chronic kidney disease, as shown by hazard ratios in individual studies at body mass index 35 v 25, sorted by average follow-up time (shortest to longest). Study acronyms/abbreviations are listed in eAppendix 2 in the supplementary materials
Central adiposity measures and risk of GFR decline
In the general population cohorts, relations between waist circumference and waist-to-height ratio with GFR decline were close to being linear (fig 8). Compared with waist circumference 92 cm in men and 78 cm in women, hazard ratios of GFR decline risk were 1.50 (95% confidence interval 1.27 to 1.76) and 0.86 (0.71 to 1.03) for waist circumferences 112 cm/98 cm and 82 cm/68 cm, respectively. Compared with waist-to-height ratio 0.5, hazard ratios were 1.49 (1.25 to 1.78) and 0.44 was 0.97 (0.82 to 1.16) for waist-to-height ratios 0.62 and 0.44, respectively (fig 8).

Association of waist circumference and waist-to-height ratio with risk of decline in glomerular filtration rate in general population cohorts, as shown by meta-analysed hazard ratios and 95% confidence intervals. Circles indicate points with significant differences in risk from the reference point (sex specific reference point for waist circumference (92 cm for men (M), 78 cm for women (F)); common reference point 0.5 cm/m for waist-to-height ratio)
In high cardiovascular risk cohorts, neither waist circumference or waist-to-height ratio was associated with GFR decline risk, similar to the associations observed with body mass index (eFigure 7A-B). In CKD cohorts, higher waist circumference and waist-to-height ratio were weakly associated with increased risk of GFR decline (eFigure 7C-D). Compared with a waist circumference of 92 cm in men and 78 cm in women, the hazard ratio was 1.32 (95% confidence interval 0.96 to 1.83) for higher circumferences of 112 cm and 98 cm, and 0.75 (0.49 to 1.15) for lower circumferences of 82 cm and 68 cm. Compared with a waist-to-height ratio of 0.5, the hazard ratio was 1.42 (1.10 to 1.83) for a waist-to-height ratio of 0.62, and 1.30 (0.84 to 2.0) for a waist-to-height ratio of 0.44.
Adiposity measures and risk of death by level of GFR
In general population cohorts, higher body mass index, waist circumference, and waist-to-height ratio were all associated with risk of death (eFigure 8). By contrast, only lower body mass index was associated with higher mortality. Associations between body mass index and death were qualitatively similar across eGFR groups in general population cohorts (eFigure 9). In models stratified by baseline eGFR, hazard ratios for body mass index 35 versus 25 were 1.45 (95% confidence interval 1.21 to 1.74), 1.36 (1.23 to 1.51), 1.31 (1.17 to 1.46), and 1.33 (1.21 to 1.46) for eGFR subgroups of 90 or more, 60-89, 30-59, and less than 30 mL/min/1.73 m2, respectively (all P values for interaction ≥0.05). The association between higher body mass index and risk of death was similar in sensitivity analyses excluding the first three years of follow-up, and when adjusted for potential mediators (body mass index 35 v 25; 1.21, 1.10 to 1.34; eFigure 10).
In high cardiovascular risk cohorts, higher body mass index, waist circumference, and waist-to-height ratio were all associated with increased risk of death, although not significantly so for waist-to-height ratio (eFigure 11). Hazard ratios for body mass indices of 35 and 20 versus 25 were 1.20 (95% confidence interval 1.02 to 1.41) and 1.47 (1.23 to 1.78), respectively. Results were similar after excluding the first three years of follow-up, and slightly attenuated when adjusted for potential mediators (body mass index 35 v 25; 1.15, 1.00 to 1.34; eFigure 12).
In CKD cohorts, higher body mass index and higher waist circumference were associated with mortality risk; waist-to-height ratio was not significantly associated with mortality risk, although only three of the six CKD cohorts were included in this analysis (eFigure 13). For body mass index, the risks of death associated with body mass indices of 35 and 20 versus 25 were hazard ratios 1.17 (95% confidence interval 1.01 to 1.37) and 1.49 (1.25 to 1.77), respectively. After excluding the first three years of follow-up, the association between higher body mass index and risk of death in CKD cohorts was stronger (body mass index 35 v 25; hazard ratio 1.48, 1.31 to 1.68; eFigure 14A). The association between higher body mass index and risk of death in CKD cohorts was attenuated when adjusted for potential mediators (body mass index 35 v 25; hazard ratio 1.01, 0.90 to 1.14; eFigure 14B).
Discussion
Principal findings
In this global meta-analysis of over five million adults, we found that body mass index over 25 was associated with increased risk of GFR decline during a mean follow-up of eight years. In the general population, body mass indices of 30, 35, and 40 were associated with 18%, 69%, and 102% increased risk of GFR decline, respectively, compared with body mass index 25. The association between elevated body mass index and GFR decline risk was qualitatively similar in subgroups by age, sex, race, level of GFR, hypertension, and diabetes status, although the magnitude of risk was lower in individuals with diabetes and higher in Asian cohorts. Adjustment for potential mediators attenuated the association between body mass index and GFR decline, although body mass indices of 35 and 40 remained associated with 28% and 46% increased risk of GFR decline, compared with body mass index 25. Associations between body mass index and GFR decline were notably weaker in the high cardiovascular risk and CKD cohorts. Findings were largely consistent in analyses using waist circumference or waist-to-height ratio.
Strengths and limitations of study
Although our analysis is the largest study to our knowledge to examine the association between adiposity and kidney outcomes, some caution should be advised in interpreting our findings. We used only one baseline measurement of body mass index, and changes in weight due to disease that occurred before cohort entry could introduce bias, potentially weakening associations between higher body mass index and adverse outcomes (that is, reverse causality). This concept could explain the weaker association in high risk cohorts, or the difference may be due in part to collider bias. For example, if obesity increases the risk for cardiovascular disease, then other risk factors, some of which are unmeasured, can be expected to be greater in individuals with cardiovascular disease who are not obese.24 Alternatively, the weaker association in high risk cohorts could signify the lack of an independent effect of body mass index on kidney outcomes in high risk individuals. We were unable to fully adjust for risk factors such as glycated haemoglobin, diabetes duration, or drug treatments, which could contribute to the association between obesity and GFR decline. Other filtration markers such as cystatin C were not available to estimate GFR25; however, our results were consistent in analyses using ESKD alone as the outcome. We lacked uniform data on trends in blood pressure control, and thus could not examine whether heterogeneity was explained by differences in treatment intensity. Lastly, we were unable to investigate whether the obesity associated decline in GFR was due to obesity itself or its determinants (eg, diet, physical activity).
Comparison with other studies
The observed risk associations in our meta-analysis between elevated body mass index and GFR decline were weaker than what had been observed in two large cohorts with longer follow-up intervals.56 For example, in a study of 320 252 adults in an integrated health system with body mass index measured between 1964-1985 and 15-35 years of follow-up, risk of ESKD was 2.6, 5.1, and 6.1-fold higher for body mass index ranges 30-34.9, 35-39.9, and 40 or more, respectively, compared with range 18.5-24.9.5 However, these two older studies could not be included in this meta-analysis.56 Our findings accord with contemporary general population studies with shorter follow-up intervals.78910 Neither follow-up time nor calendar year explained heterogeneity in the association between higher body mass index and GFR decline in our study, but we had relatively few cohorts with data from before the 1980s.
We speculate that differences in metabolic health profiles and management of obesity related conditions could explain heterogeneity in study findings.26 For example, while prevalence of obesity and diabetes increased in the United Kingdom from 2003 to 2009-10 and in Norway from 1995-97 to 2006-08, prevalence of CKD in these countries decreased (UK) or remained stable (Norway).2728 These discordant trends could be partly explained by simultaneous improvements in blood pressure control in both countries.
Our study confirms a possible advantage of using waist circumference over body mass index in assessing mortality risk in cohorts with CKD.122930 Both elevated body mass index and waist circumference were associated with increased mortality risk, but no increased risk of death was observed at low waist circumference, unlike body mass index. Thus, assessment of central obesity should be considered in situations where mortality risk prognostication affects management decisions (eg, kidney transplant candidacy).31 Reverse causation might also partly explain null or paradoxical relations between elevated body mass index and risk of death reported in previous studies of CKD cohorts,1114 because after excluding the first three years of follow-up in the meta-analysis of our CKD cohorts, higher body mass index was more strongly associated with death. Alternatively, obesity could confer short term protective effects in individuals at risk for malnutrition, such as those with advanced CKD or ESKD.30 While post hoc analyses of Look AHEAD (Action for Health in Diabetes) suggest a beneficial effect on preventing or slowing progression of CKD in individuals with diabetes, further research is needed to determine the effects of weight loss in patients with CKD.32
What is already known on this topic
-
Several studies have reported an association between obesity and end stage kidney disease (ESKD), although the magnitude of the association has varied considerably between studies
-
Some cohort studies of chronic kidney disease (CKD) have suggested that obesity is associated with no increased risk, or paradoxically lower risk of death
-
Meta-analyses examining the relation between body mass index and CKD have been limited by lack of individual participant data and have not included measures of central adiposity such as waist circumference
What this study adds
-
Obesity is associated with increased risk of GFR decline and mortality in individuals with and without CKD
-
These findings suggest that worldwide increases in obesity prevalence could lead to future increases in CKD and ESKD prevalence
Acknowledgments
A poster presentation of this work was presented at the American Society of Nephrology Kidney Week in New Orleans, LA, USA in November 2017.
Footnotes
-
Contributors: MEG and KM had full access to all of the data in the study and take responsibility for the integrity of the data and the accuracy of the data analysis. ARC, MW, MEG, KM, RTG, and ASL were responsible for the study concept and design. MEG, SHB, and KM with the CKD-PC investigators/collaborators listed below were involved in the acquisition of data. All the authors contributed to the analysis and interpretation of data and to the critical revision of the manuscript for important intellectual content. ARC, MW, and MEG drafted the manuscript. MEG guarantees the integrity of the work. The corresponding author attests that all listed authors meet authorship criteria and that no others meeting the criteria have been omitted.
-
CKD Prognosis Consortium (CKD-PC) investigators/collaborators (study acronyms/abbreviations are listed in eAppendix 2 in the supplementary materials): AASK: Brad Astor, Larry Appel, Tom Greene, Teresa Chen; ADVANCE: John Chalmers, Mark Woodward, Hisatomi Arima, Vlado Perkovic; Aichi: Hiroshi Yatsuya, Koji Tamakoshi, Yuanying Li, Yoshihisa Hirakawa; ARIC: Josef Coresh, Kunihiro Matsushita, Morgan Grams, Yingying Sang; AusDiab: Kevan Polkinghorne, Steven Chadban, Robert Atkins; BC CKD: Adeera Levin, Ognjenka Djurdjev; Beaver Dam CKD: Ron Klein, Barbara Klein, Kristine Lee; Beijing: Luxia Zhang, Lisheng Liu, Minghui Zhao, Fang Wang, Jinwei Wang; CanPREDDICT: Adeera Levin, Ognjenka Djurdjev, Mila Tang; CARE FOR HOMe: Gunnar Heine, Insa Emrich, Adam Zawada, Lucie Bauer; CCF: Joseph Nally, Sankar Navaneethan, Jesse Schold; ChinaNS: Luxia Zhang, Minghui Zhao, Fang Wang, Jinwei Wang; CHS: Michael Shlipak, Mark Sarnak, Ronit Katz, Jade Hiramoto; CIRCS: Hiroyasu Iso, Kazumasa Yamagishi, Mitsumasa Umesawa, Isao Muraki; CKD-JAC: Masafumi Fukagawa, Shoichi Maruyama, Takayuki Hamano, Takeshi Hasegawa, Naohiko Fujii; COBRA: Tazeen Jafar, Juanita Hatcher, Neil Poulter, Nish Chaturvedi; CRIB: David Wheeler, John Emberson, John Townend, Martin Landray; ESTHER: Hermann Brenner, Ben Schöttker, Kai-Uwe Saum, Dietrich Rothenbacher; Framingham: Caroline Fox, Shih-Jen Hwang; GCKD: Anna Köttgen, Florian Kronenberg, Markus P Schneider; Kai-Uwe Eckardt; Geisinger: Jamie Green, H Lester Kirchner, Alex R Chang; Gonryo: Sadayoshi Ito, Mariko Miyazaki, Masaaki Nakayama, Gen Yamada; Gubbio: Massimo Cirillo; HUNT: Stein Hallan, Solfrid Romundstad, Marius Øvrehus, Knut Asbjørn Langlo; IPHS: Fujiko Irie, Toshimi Sairenchi; JHS: Adolfo Correa, Casey M Rebholz, Bessie Young, L Ebony Boulware; JMS: Shizukiyo Ishikawa, Yuichiro Yano, Kazuhiko Kotani, Takeshi Nakamura; KHS: Sun Ha Jee, Heejin Kimm, Yejin Mok; KP Hawaii: Brian J Lee; Maccabi: Gabriel Chodick, Varda Shalev; MASTERPLAN: Jack F M Wetzels, Peter J Blankestijn, Arjan D van Zuilen, M Bots; MDRD: Mark Sarnak, Lesley Inker; MESA: Michael Shlipak, Mark Sarnak, Ronit Katz, Carmen Peralta; MMKD: Florian Kronenberg, Barbara Kollerits, Eberhard Ritz; MRC: Dorothea Nitsch, Paul Roderick, Astrid Fletcher; Mt Sinai BioMe: Erwin Bottinger, Girish N Nadkarni, Stephen B Ellis, Rajiv Nadukuru; Nefrona: Jose M Valdivielso, Elvira Fernandez, Angels Betriu, Marcelino Bermudez-Lopez; NephroTest: Benedicte Stengel, Marie Metzger, Martin Flamant, Pascal Houillier, Jean-Philippe Haymann, Marc Froissart; NHANES: Yingying Sang; NIPPON DATA80: Hirotsugu Ueshima, Akira Okayama, Katsuyuki Miura, Sachiko Tanaka; NIPPON DATA90: Hirotsugu Ueshima, Tomonori Okamura, Katsuyuki Miura, Sachiko Tanaka; NZDCS: Timothy Kenealy, C Raina Elley, John F Collins, Paul L Drury; Ohasama: Takayoshi Ohkubo, Kei Asayama, Hirohito Metoki, Masahiro Kikuya, Masaaki Nakayama; Okinawa 83/93: Kunitoshi Iseki, Chiho Iseki; Pima: Robert G Nelson, William C Knowler; PREVEND: Ron T Gansevoort, Stephan J L Bakker, Hiddo J L Heerspink; PSP-CKD: Nigel Brunskill, Rupert Major, David Shepherd, James Medcalf; Rancho Bernardo: Simerjot K Jassal, Jaclyn Bergstrom, Joachim H Ix, Elizabeth Barrett-Connor; RCAV: Csaba Kovesdy, Kamyar Kalantar-Zadeh; Keiichi Sumida; REGARDS: Paul Muntner, David Warnock, Suzanne Judd, Bhupesh Panwar; RENAAL: Hiddo J L Heerspink, Dick de Zeeuw, Barry Brenner; RSIII: Sanaz Sedaghat, M Arfan Ikram, Ewout J Hoorn, Abbas Dehghan; SEED: Tien Yin Wong, Charumathi Sabanayagam, Ching-Yu Cheng, Riswana Banu Binte Mohamed Abdul Sokor; SMART: Frank L J Visseren; SRR-CKD: Marie Evans, Mårten Segelmark, Maria Stendahl, Staffan Schön; Sunnybrook: Navdeep Tangri, Maneesh Sud, David Naimark; Taiwan MJ: Chi-Pang Wen, Chwen-Keng Tsao, Min-Kugng Tsai, Chien-Hua Chen; Takahata: Tsuneo Konta, Atsushi Hirayama, Kazunobu Ichikawa; TLGS: Farhad Hosseinpanah, Farzad Hadaegh, Mohammadhassan Mirbolouk, Fereidoun Azizi; Tromso: Marit Dahl Solbu, Trond Geir Jenssen, Bjørn Odvar Eriksen, Anne Elise Eggen; ULSAM: Lars Lannfelt, Anders Larsson, Johan Ärnlöv; ZODIAC: Henk J G Bilo, Gijs W D Landman, Kornelis J J van Hateren, Nanne Kleefstra.
-
CKD-PC steering committee: Josef Coresh (chair), Ron T Gansevoort, Morgan E Grams, Stein Hallan, Csaba P Kovesdy, Andrew S Levey, Kunihiro Matsushita, Varda Shalev, Mark Woodward.
-
CKD-PC data coordinating centre: Shoshana H Ballew (assistant project director), Jingsha Chen (programmer), Josef Coresh (principal investigator), Morgan E Grams (director of nephrology initiatives), Lucia Kwak (programmer), Kunihiro Matsushita (director), Yingying Sang (lead programmer), Aditya Surapaneni (programmer), Mark Woodward (senior statistician).
-
Some of the data reported here were supplied by the United States Renal Data System (USRDS). The interpretation and reporting of these data are the responsibility of the authors and in no way should be seen as an official policy or interpretation of the US government. The views expressed in this manuscript are those of the authors and do not necessarily represent the views of the National Heart, Lung, and Blood Institute; National Institutes of Health; or US Department of Health and Human Services.
-
Funding: The CKD-PC data coordinating centre is funded partly by a programme grant from the US National Kidney Foundation and the National Institute of Diabetes and Digestive and Kidney Diseases (NIDDK; R01DK100446-01). Various sources have supported enrolment and data collection including laboratory measurements, and follow-up in the collaborating cohorts of the CKD-PC; these funding sources include government agencies such as national institutes of health and medical research councils as well as foundations and industry sponsors listed in eAppendix 3. The funders of the study had no role in study design, data collection, data analysis, data interpretation, or writing of the report. ARC was supported by NIDDK (1K23DK106515-01).
-
Competing interests: All authors have completed the ICMJE uniform disclosure form at www.icmje.org/coi_disclosure.pdf and declare: part support from the US National Kidney Foundation and the National Institute of Diabetes and Digestive and Kidney Diseases for the submitted work; ARC was supported by the NIDDK; no other financial relationships with any organisations that might have an interest in the submitted work in the previous three years; no other relationships or activites that could appear to have influenced the submitted work.
-
Ethical approval: Ethical approval was provided by the Johns Hopkins Bloomberg School of Public Health institutional review board.
-
Data sharing: CKD-PC has agreed with collaborating cohorts not to share data outside the consortium. Each participating cohort has its own policy for data sharing.
-
The lead author affirms that this manuscript is an honest, accurate, and transparent account of the study being reported; that no important aspects of the study have been omitted; and that any discrepancies from the study as planned (and, if relevant, registered) have been explained.
This is an Open Access article distributed in accordance with the Creative Commons Attribution Non Commercial (CC BY-NC 4.0) license, which permits others to distribute, remix, adapt, build upon this work non-commercially, and license their derivative works on different terms, provided the original work is properly cited and the use is non-commercial. See: http://creativecommons.org/licenses/by-nc/4.0/.