Article Text

Abstract
Study objective: To examine social inequalities and trends in low birth weight in England and Wales.
Design: Analysis of routine birth data, comparing (a) couple and sole registered births, and (b) manual and non-manual occupational groups.
Setting: England and Wales, 1993–2000.
Main results: Social inequalities in low birth weight were evident throughout 1993–2000: relative to the non-manual group, there is an increased risk for the manual group (range in RR 1.22–1.35) and sole registrations (RR 1.51–1.67). An estimated 6.5% (2979 births) of low birth weight in 2000 could have been avoided if risks associated with the manual group were absent, and 2.8% (1290 births) avoided if risks associated with sole registration were absent. Between 1993 and 2000, the low birthweight rate increased significantly with an estimated overall increase of 11%. Increases were evident in all social groups (15% in manual, 11% in sole registrations and 9% in non-manual); however relative to non-manual the increase in RRs were not statistically significant for manual or sole registrations. When multiple births are excluded, the rate of low birth weight is reduced but there is still a significant increase over time and social differentials are undiminished.
Conclusions: There are social inequalities in low birth weight in England and Wales that have not narrowed over an eight year period, 1993–2000. These inequalities are likely to affect childhood and adult health inequalities in the future, hence strategies will need to address differences in low birth weight and further monitoring of trends is therefore desirable.
- birth weight
- inequalities
- social class
- time trends
Statistics from Altmetric.com
In August 2000 the NHS Plan announced national health inequality targets for England, later specified as: (1) infant mortality: starting with children under 1 year, by 2010 to reduce by at least 10% the gap in mortality between manual groups and the population as a whole; and (2) expectation of life: starting with health authorities, by 2010 to reduce by at least 10% the gap between the quintile of areas with the lowest life expectancy at birth and the population as a whole.1 Action across a range of factors will be required to achieve these targets and, thus, trends in key indicator variables are of great interest.
One such indicator is birth weight, which is relevant to both infant mortality and life expectancy. Birth weight is inversely related to infant mortality; in England and Wales in 1999 the infant mortality rate of babies weighing 3500 grams and over was 1.4, 2500–2999 grams 4.3, 2000–2499 grams 9.1, and under 1500 grams over 200 per 1000 live births.2 Sixty two per cent of infant deaths in 1999 were to low weight babies (under 2500 g).2 Weight at birth is also predictive of other childhood outcomes, including linear growth,3 cognition,4–6 and disability.7 Low weight and premature infants have, in particular, increased incidence of neurological deficits or poorer cognitive skills throughout childhood.4–6 In addition, birth weight is related to adult outcomes: lower weight infants have on average shorter adult stature,8 increased blood pressure,9 increased risk of non-insulin dependent diabetes,10 and, in later life, higher rates of fatal and non-fatal coronary heart disease, stroke, and obstructive lung disease.11–13 There is also evidence that birth weight in one generation affects pregnancy outcome in the next generation.14,15 Weight at birth varies by socioeconomic factors2,14,16 and hence is likely to influence social inequalities in infant mortality, life expectancy, and longer term health.
In this paper we examine the extent of social inequalities and trends in birth weight in England and Wales, focusing specifically on low birth weight. Paradoxically, while in recent years the general trend has been towards heavier births, the low birthweight rate has also increased2,17,18 possibly because of changes in multiplicity and age at child bearing.2,19 Low birth weight is often associated with the most adverse health outcomes and, hence, social trends in this factor are likely to be informative in relation to subsequent inequalities.
METHODS
This study uses birth registration and notification (for birth weight) data for live births in England and Wales 1993 to 2000. (In England and Wales all births are required by law to be registered within 42 days of their occurrence; birth weight is notified to the health authority by the hospital, or the midwife or doctor attending the birth19). Low birth weight is defined as under 2500 g. Births without recorded birth weight are excluded from the calculations of low birthweight rates; from 1995 to 2000 these amounted to 0.1%–0.4% of live births, but were more in 1993 (3.3%) and 1994 (2.5%). Births are separated into those inside marriage or outside marriage but jointly registered by both parents (referred to as couple registrations) and those outside marriage registered by the mother alone (sole registrations). Sole registrations consist largely of babies to lone mothers.20 Couple registrations are assigned a social class on the basis of father’s occupation (current/latest job), a process which the Office for National Statistics undertakes for a sample of one in 10 of live births.19 Hence all social class analyses are based on 10% of records. Social classes I (professional), II (managerial/technical), and IIIN (skilled non-manual) are aggregated into the non-manual group, and IIIM (skilled manual), IV (partly skilled), and V (unskilled) into the manual group. The “other” social group includes armed forces, inadequately described and no stated occupations, students, and homecarers. Sole registrations remain a separate category as they cannot be classified using father’s occupation. Some analyses separate multiple and singleton births.
Inequalities in low birth weight are expressed both as relative risk (RR) and as population attributable risk per cent (PAR%) to convey respectively (a) the strength of associations and (b) the excess rate of low birth weight in the population that is attributable to being in a specific social group. Most comparisons are between three (mutually exclusive) groups: non-manual couple, manual couple, and sole registrations. RR was defined as ps/pr, where ps is the low birthweight rate in a specific social group (manual or sole registrations) and pr the rate in the reference (non-manual) group. The 95% CI for RR was calculated by taking the exponential of the CI for log (RR), which has the formula

where ns and nr are the total number of births in the specific social group and the reference (non-manual) group. PAR% was defined as 100×(p-q)/p, where p is the rate of low birth weight in the whole population, and q the corresponding rate in the population excluding the social group of interest. The 95% CI for PAR% was calculated.21
Annual rates of low birth weight were calculated for 1993–2000 for manual, non-manual, all couple, and sole registrations. Trends in the low birthweight rate were examined using a binomial regression model with log link function, with year of birth as the explanatory variable. Trends in RR for manual and sole (versus non-manual) were further examined by testing the interaction of year and social group. This analysis was carried out using SAS on UNIX.
RESULTS
In 2000, 92.4% of all live births were couple registrations (43% non-manual, 45% manual) and 7.6% sole registrations. Some 7.4% of couple registrations were low birth weight with a gradient across the social classes (6.4% non-manual, 8.2% manual). There were significant differences within the non-manual group (between SCII and SCIIIN) and within the manual group (between SCIIIM and SCIV). The highest rate of low birth weight was among sole registrations (10.2%) (table 1A).
Percentage low birthweight births (95% CI) by registration type and fathers social class: 2000*
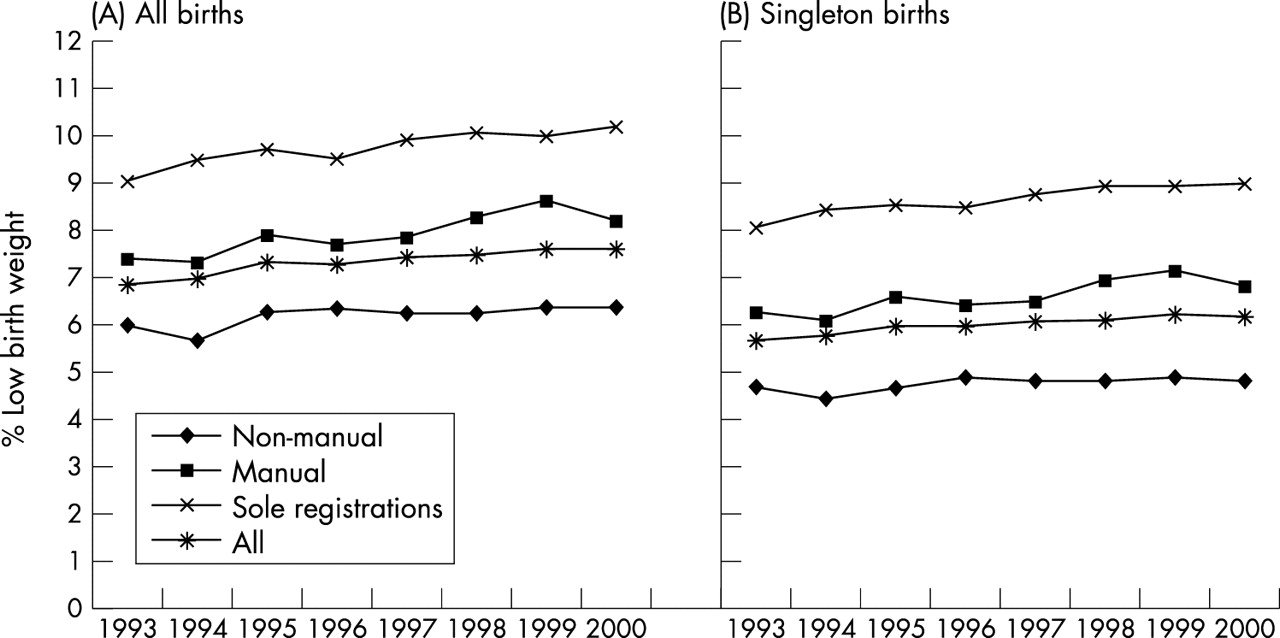
Social inequalities in low birth weight are evident throughout 1993–2000, with the highest rates among sole registrations and large differentials between manual and non-manual groups (fig 1A). The RR of low birth weight varies between 1.22 and 1.35 for the manual (versus non-manual) group, and 1.51–1.67 for sole registrations (versus non-manual) (table 2A). The PAR% indicate that about 6.5% of all low birth weight in 2000 (equivalent to 2979 births in the population) could have been prevented if the risks associated with the manual group were absent (95% CI: 5.3% to 7.8%; 2402–3550 births). Similarly, about 2.8% (1290 cases) of all low birth weight could have been avoided if risks associated with sole registration were absent (95% CI: 2.5% to 3.1%; 1150–1433 births). In other words, in 2000 the low birthweight rate would reduce from 7.6% to 7.1% in the absence of risks associated with the manual group, or to 7.4% in the absence of risks associated with sole registration.
Social inequalities in low birth weight: 1993–2000 (relative risk (95% CI))

Percentage low birthweight births by registration type and social class, all and singleton births: 1993–2000.
Between 1993 and 2000, the low birthweight rate increased significantly, with an estimated overall increase of 10.8%. The rise was evident in all social groups, with estimated overall increases of 15.0% in manual, 11.0% in sole registrations and 8.8% in non-manual groups. However, the relative difference between social groups, as indicated by the relative risk (RR) for manual (versus non-manual) or sole registrations (versus non-manual) did not increase significantly.
In 2000 the multiple birth rate was higher among couple than sole registrations, and lower among manual than non-manual groups (table 3). For these reasons we repeated the analyses excluding multiple births; there remains a significant increase in the low birthweight rate over time (fig 1B). Among singletons the rate of low birth weight is reduced but social differentials are undiminished and are, if anything, slightly larger (table 1B); they persist throughout 1993–2000 (table 2B). The RR of low birth weight is 1.31–1.45 for the manual group and 1.71–1.90 for sole registrations.
Percentage multiple births (95% CI) by registration type and fathers social class: 2000
DISCUSSION
Since 1994 7% or more of live births have been of low weight. This is a sizeable proportion of births and is higher than any year since 1953 when recording began.2,17 The recent increase in low birth weight is only partially accounted for by multiple births. Social class differences in low birth weight are evident, with consistently higher percentages in manual compared with non-manual groups, and even higher percentages among sole registrations. At the population level the implications of these differences are considerable: if all live births in 2000 experienced the low birthweight rates of the non-manual group, over 7200 low weight births would have been avoided—a reduction of 16% on the actual number of such births. The relative risk of low birth weight for the manual compared with the non-manual group did not decrease, but tended to increase slightly between 1993 and 2000 though not significantly. Similarly, the situation of sole registration births in relation to the non-manual group did not improve. Social differentials are not attributable to multiple births.
Strengths and weaknesses of the study
This analysis uses routine birth registration data covering all births in England and Wales. Birth data before 1993 are less readily accessible for analysis than more recent births and, hence, are not included here. However, data for the 1980s show no discernible trend in inequalities in low birth weight.17 Father’s occupation is coded for only 10% of live births and, although traditionally used for classifying births to a social class,2 has limitations. It cannot be used for sole registrations. It would arguably be more appropriate to use mothers characteristics when dealing with outcomes of pregnancy. However, occupation is the only socioeconomic characteristic recorded at birth and death registration, and although mother’s occupation has been collected at birth since 1986, it too has problems.22 By 1999 only 61% of live births had mother’s occupation recorded. Occupational class does not differentiate well between women’s jobs, and there remains the issue that women’s lives cannot be summarised by their paid employment alone.22,23 One of the most vulnerable groups, young parents, frequently cannot be classified, having never had an occupation.
We examined trends in low birth weight, thereby concentrating on the lower tail of the birthweight distribution; there are also social class differentials in mean birth weight24 that show no discernible improvement (unpublished data). Throughout 1993–2000, compared with non-manual, sole registrations had a mean birth weight 151–171 g lower, and the manual group 63–89 g lower. However, low birth weight is of interest in its own right because the most adverse health risks tend to be experienced by this group and also because of the recent rise in prevalence. In 2000 7.6% of live births weighed under 2500g, while from 1953 to 1994 the prevalence fluctuated between 6.4% and 7.0%.2,17 Changes in age at childbearing and increases in multiplicity may have contributed to this trend. The mean age of mothers at live birth increased from 27.3 in 1989 to 29.0 in 1999; the proportion of live births to older mothers also increased.19 Seven per cent of live births to mothers 25–34 are low weight compared with over 9% among teenage mothers and mothers 40 years and over.2 Multiple births increased from 2.1% of live births in 1986 to 2.9% in 1999.2 In 1999 56.0% of multiples were of low birth weight compared with 6.2% of singletons; consequently although only 2.9% of all live births were multiples they accounted for over one fifth of low weight births. We have assessed the part that multiplicity plays in the trends in inequalities in low birth weight but other demographic factors may lie behind the differentials and trends observed and will be the subject of future work.
Key points
-
The low birthweight rate increased significantly 1993–2000; this increase was only partially accounted for by multiple births.
-
Manual/non-manual differences in low birth weight did not diminish 1993–2000, nor did the situation of sole registered births improve relative to the non-manual group.
-
Social inequalities in low birth weight, including indications that these are not narrowing, may influence future levels of health, and their inequalities.
Policy implications
-
To ensure a reduction in inequalities later in life strategies need to address social differences in low birth weight.
-
Low birth weight, including among sole registered births, should be monitored as part of the government infant mortality inequality target.
-
Recording of mothers’ occupation at birth registration needs to be improved, and the recording of other socioeconomic information considered.
Policy implications
The absolute difference between groups in the low birthweight rate gives an indication of the impact for public health. In 2000, compared with the non-manual group, sole registrations had 3.8 more low weight births per 100 and the manual group 1.8 more. When only singletons are considered the differences are larger. These inequalities have health service resource implications, as low weight infants are more likely to require intensive neonatal care. Moreover, the links between birth weight and health in later life, reported elsewhere,3−15 suggest that the trends we describe for low birth weight may influence future population levels of health, and their inequalities.
Our findings are of relevance to the government health inequality targets. The infant mortality target compares the manual group with couple registrations (referred to as “population as a whole” in the target); sole registered births, although excluded from the target, are also to be closely monitored.1,25 Concerning this target our results suggest that low birth weight needs to be monitored alongside other indicators. Birth weight is a characteristic of all births and would be easier to monitor sub-nationally than infant mortality where numbers are small.
Sole registrations are an important group when addressing inequalities in infant mortality and low birth weight. Their low birthweight rate far exceeds that of any other social group, they form a sizeable and growing proportion of live births, and have very high infant mortality.1,2,25 Mothers of sole registrations are young compared with all mothers, which partly explains the high rate of low birth weight in this group, given the U shaped relation between low birth weight and age of mother.2 A higher percentage of sole registrations occur in deprived areas than percentage of couple registrations.16 Lone mothers are disadvantaged compared with couple mothers, being more likely to be poor, to have no access to a car, to be without educational qualifications, and, if in employment, to have manual jobs.26
A reduction in inequalities in infant mortality and health in later life is unlikely to be achieved without a narrowing of inequalities in birth weight.27 Working towards such a narrowing must therefore be addressed with the utmost urgency especially as factors affecting birth weight are from both the long and short-term14 and inequalities in birth weight are therefore likely to take more than a generation to redress.
REFERENCES
Footnotes
-
Funding: none.
-
Conflicts of interest: none declared.
-
Crown copyright 2003. Published with the permission of the Controller of HMSO and the Queen’s Printer for Scotland.