Article Text

Abstract
Background Previous research suggests that the Great Depression led to improvements in public health. However, these studies rely on highly aggregated national data (using fewer than 25 data points) and potentially biased measures of the Great Depression. The authors assess the effects of the Great Depression using city-level estimates of US mortality and an underlying measure of economic crisis, bank suspensions, at the state level.
Methods Cause-specific mortalities covering 114 US cities in 36 states between 1929 and 1937 were regressed against bank suspensions and income data from the Federal Deposit Insurance Corporation Database, using dynamic fixed-effects models and adjustments for potential confounding variables.
Results Reductions in all-cause mortalities were mainly attributable to declines in death rates owing to pneumonia (26.4% of total), flu (13.1% of total) and respiratory tuberculosis (11.2% of total), while death rates increased from heart disease (19.4% of total), cancer (8.1% of total) and diabetes (2.9%). Only heart disease can plausibly relate to the contemporaneous economic shocks. The authors found that a higher rate of bank suspensions was significantly associated with higher suicide rates (β=0.32, 95% CI 0.24 to 0.41) but lower death rates from motor-vehicle accidents (β=−0.18, 95% CI −0.29 to −0.07); no significant effects were observed for 30 other causes of death or with a time lag.
Conclusion In contrast with existing research, the authors find that many of the changes in deaths from different causes during the Great Depression were unrelated to economic shocks. Further research is needed to understand the causes of the marked variations in mortality change across cities and states, including the effects of the New Deal and Prohibition.
- Mortality
- great depression
- recession
- bank crisis
- history
- multicausation
- social epidemiology
Statistics from Altmetric.com
Introduction
When the full record of the year 1931 is written, no chapter will be more striking than the one dealing with public health. The country was in the grip of the most serious industrial depression in a generation. No large area was exempt from its effects. Town and country, farmer and mechanic, East and West, North and South—all were affected. Everywhere poverty was accentuated. Family budgets had to be sharply reduced. Men and women skimped their own rations to provide for their children. The demands on charitable organisations were without parallel, coming often from families who never before knew the meaning of want. By all the signs and all the precedents, hard times so seriously prolonged should have brought in their train disease and death. Actually, 1931 was one of the healthiest years in the history of the country. The evidence is overwhelming.—New York Times, 5 January 19321
The 2008 financial crisis has been likened to the Great Depression. Both crises were characterised by the early onset of distress in the banking sector, which spread rapidly to many countries and led to significant and prolonged economic hardship for entire populations. Hence, many governments have drawn economic lessons from the Great Depression, launching large fiscal stimulus programmes to sustain consumer spending, easing monetary policy to maintain investment (creating money, lowering interest rates) and boosting financial relief for the unemployed.2 These responses were partially inspired by Roosevelt's New Deal programmes, widely thought to have eased the human costs of the Depression and sped up recovery (although there are some dissenting views).3 4 There may also be lessons for public health policy,5 but for this to happen, it is important first to understand the health consequences of the Great Depression.
The Great Depression in the USA is usually dated from ‘Black Tuesday,’ 29 October 1929, when the American stock market crashed. Over the subsequent 4 years, unemployment in the USA increased more than sevenfold, industrial output plummeted, over 3000 banks collapsed, and world trade shrank even further as countries retaliated against rising US tariffs with their own protective tariffs. Recovery began in early 1933, and while the precise reasons remain the subject of debate, many attribute it to Roosevelt's New Deal, a package implemented that year that included relief for the unemployed and impoverished farmers, reform of financial regulation and government promotion of recovery through programmes of support for wages and prices.
Although much has been written about the health effects of subsequent economic recessions,5–19 with widely varying findings depending on the study context and measures of the economy used, generally they indicate that suicides tend to rise during downturns, while risks associated with economic and transportation activity, such as road-traffic fatalities, tend to fall.5 11 19 However, as the authors of one recent paper have noted, ‘few if any studies have specifically focused on the evolution of population health during the Great Depression.’14 Thus, search of PubMed for ‘Great Depression’ or ‘Wall Street Crash’ and ‘mortality’ reveals only the recent paper by Tapia Granados and Diez Roux, which looks at the association between US national trends in mortality and changes in gross domestic product between 1920 and 194014 and a study investigating the nutritional crisis in Nazi Germany in the mid-1930s.20 Hence, it was necessary to search other databases including EconLit, as well as the archives of the New York Times and Washington Post, with a hand search of leading journals published at the time, and follow-up of cited references. This search identified several papers in the 1930s addressing the potential health consequences of recession, including a special issue in the League of Nations Quarterly Bulletin of Health Organisation,21–23 some papers in Milbank Memorial Quarterly24 25 and US Public Health Reports,26 but there is little further analysis. Several expressed puzzlement at the findings they observed, such as a decline in deaths among infants and from tuberculosis at a time when the economy was collapsing, although there were also some expected findings, such as increased malnutrition among the poor27 and increased infant mortality in some areas experiencing high unemployment.24 One aggregated analysis by the former editor of the BMJ, Douglas Swinscow, reported a positive correlation between unemployment and suicide in Britain between 1923 and 1947.28 A more recent study of the New Deal and mortalities by economic historians reported short-term associations of spending on social protection during the New Deal with reduced mortality due to infectious and parasitic disease, diarrheal disease, and suicides (using data on fluctuations in retail sales at the city level),29 while that by Tapia Granados and Diez Roux found that, at a national level in the USA, using 21 data points, recessions during the 1920s and 1930s coincided with an overall decline in mortality, consistent with their earlier research elsewhere.17
Despite this limited evidence base, recent commentators have coined the term ‘econocide’ to describe the phenomenon of high-profile suicides by individuals who have suffered in the current financial crisis, linking it explicitly to the iconic images of financiers jumping from New York skyscrapers in the 1930s.30 Yet, consistent with the recent analysis by Tapia Granados and Diez Roux,14 accounts in the US media at the time indicated widespread health improvements (with the exception of a rise in suicides). As one reporter put it, just 1 year into the slump, ‘Never before have there been such satisfactory health conditions in the USA and Canada as during the first 9 months of this year.’ (New York Times, 26 October 1930).31 For the first time since the invention of the automobile, traffic deaths reportedly fell (New York Times, 28 November 1932)32: ‘The traffic fatalities in September 1931, were thirty-seven fewer than in September, 1930…Decrease in deaths unexplained.’ (New York Times, 11 October 1931).33 Reductions in deaths due to infectious diseases were also reported, prompting one commentator to note that, ‘It is in many ways remarkable that after 2 years of serious economic depression the tuberculosis death rate should continue its declining trend, for much historical and present-day discussion has stressed the close relation between the tuberculosis death rate and economic and social conditions.’ (New York Times, 30 October 1931).34
In the 1930s, numerous explanations for these observations prevailed, ranging from the unusually favourable weather to previous public health investments to the slump itself (box 1).
1930s Explanations for the improved health conditions during the Great Depression
Public-health analysts were puzzled by the improvements in mortality that occurred during the 1930s: ‘Just what caused this gratifying showing it is difficult to say.’ (New York Times, 5 January 1932).
Explanations for why there was ‘no slump in health’ (New York Times, 5 January 1932)1 included the ‘slump is held to be a factor’ (Associated Press, 15 February 1932)35; ‘the weather has been a contributing factor’ (New York Times, 15 February 1932); ‘absence of unpreventable epidemics’ (New York Times, 5 January 1932); ‘a more normal mode of living than in boom times another’ (New York Times, 15 February 1932); ‘the effect of the (public health) work of the last 25 or 30 years has been cumulative in nature’; and ‘the medical profession is becoming more and more skilled in the diagnosis and treatment of the disease’ (New York Times, 30 October 1931).24
Some attributed rising suicide and homicides to Prohibition: ‘Homicide rate up; Prohibition blamed’ (New York Times, 20 March 1930),36 explaining that ‘the enforcement of Prohibition has brought into existence an organisation of crime and criminals such as no other country on the face of the globe has ever know in the history of its past.’
Others, foreshadowing later research on the media and suicides,37 blamed news reporting: ‘Do you not feel that we could lessen the present epidemic of suicides by taking them off the front page?…it would help to diminish the suicides if we could get less publicity on this trying subject’ (New York Times, 29 March 1932).
In this paper, we will examine these contemporary explanations of the fluctuations in mortality by combining a new measure of the economic shock of the Great Depression, bank suspensions, with data on cause-specific mortality covering US urban populations during the Great Depression. Our approach advances the existing knowledge about the health effects of the Great Depression by looking at what happened in different states. This is important because of the risk of spurious associations in national-level analyses when there are underlying trends in mortality that are unconnected with economic effects, exemplified by the epidemiological transition from infectious to non-communicable diseases.38 Existing research on different time periods has identified economy-health correlations that appear contradictory on the surface but may actually have resulted from an unobserved correlation with uncorrected for (residual) long-term trends in the data. Granados and colleagues report procyclical cancer–economy associations, but only during a period of substantially rising cancer mortality amidst the postwar growth of the US economy (1940–1975).13
To capture state-level economic events, we use the percentage of banks in a given state that were suspended in each year. This is one of the very few measures available to capture state-level variation in the impact of the Great Depression and was an iconic feature of it. Importantly, at that time, banks were not allowed to operate across state borders, whereas workers and production crossed these boundaries. Bank suspensions are initially a stressful shock. Banks may ‘suspend’ temporarily, but no one knew at the time how permanent this would be, creating a loss of a sense of control. This uncertainty could clear up quickly of course, so a more precise measure of economic hardship was the banks that failed permanently. Still many banks attempted to repay depositors. However, the failures were associated with a economic breakdown—with the banks no longer able to act as financial intermediaries and a lower money supply to name two principal channels—and it appears that up to 1933, an increasing proportion of banks that were suspended eventually failed. Hence, the available data on bank suspensions tracks both uncertainty and a rise in the direct economic shock.
Bank suspensions often arose for two reasons: either because of depositor panic uncorrelated with the fundamental solvency of the banking sector but which ultimately led to failures and thus an independent source of variability for the economy or due to deterioration of financial and real asset values. Evidence suggests that the bank suspensions of early 1933 were of the former variety.39–41 These suspensions were a very visible short-term economic ‘shock’ and have the measurement advantage of being uncorrelated with past levels of income (figure 1). In our dataset (described in greater detail below), they correlate more strongly with changes in personal income per capita (r=−0.50, p<0.01 in our sample) than the level of income (r=−0.16, p<0.01) (with the latter arising only because bank suspensions led to major drops in income), and reject more strongly the presence of a unit root than income. Personal income data also have the limitation of including buffers and transfer payments (like relief spending), and reflects the coping strategies adopted by people to smooth consumption in response to reduced income. Thus, bank suspensions enable us to disentangle the effects of the underlying shock from the social welfare responses of government. We adjusted personal income data to be net of transfers

Trends in measures of the economy, 36 states, 1927–1937. GDP data are in constant 1967 dollars.
Clearly, association does not equate to causation. Consequently, we decompose short- and long-term trends in mortality using standard epidemiological methods to identify the causes of death that fluctuated during the Great Depression. This enables us to assess the biological plausibility and consistency of observed econometric state-level associations, additionally fulfilling two of the Bradford-Hill criteria of causality.42 Together, these steps reveal that traditional ecological methods used to study economy–mortality associations can yield spurious correlations.
Methods
Data on 50 leading causes of death in the then 115 US cities, which were located in 36 US states, were taken from the US Bureau of the Census for the years 1929–1937,43 building on the existing dataset of Fishback, Haines, and Kantor.29 Washington DC was excluded because of the lack of corresponding state data. Mortality in the remaining 114 cities covered roughly 30% of the 1930 US census estimate of 123 million US population. In the first stage of the analysis, we performed an epidemiological assessment of the immediate causes of death that were attributable for the short-term fluctuations observed between 1929 and 1937. We calculated the percentage of mortality change attributable to the 10 leading causes of falling and rising death rates, thus identifying which causes of death could plausibly relate to short-term economic shocks.
In the second stage of the analysis, we investigated the potential determinants of these short-term fluctuations. Here, weighted means of statewide urban mortalities were calculated based on estimated city populations (weighted meani=Σ MRkwk, where MR is the city-specific mortality, i is the state, k is the city, and w is the weight given by the city population divided by the sum of the city populations in that state), giving rise to 324 state-years of data for analysis. Similar methods were used to estimate the overall US weighted mean of mortalities based on city populations so as to be representative of the USA in the descriptive analysis of epidemiological trends. State-level bank suspensions data were from the Federal Reserve Bulletins contained in the Federal Deposit Insurance Corporation database.44
To isolate short-term fluctuations, we applied the widely used Hodrick–Prescott filter (HP), a technique which decomposes movements in time-series data into short-term and trend components, to the mortalitydata series, in two steps. First, the HP filter finds a smoothed time trend in the log level of the mortality for each state. Then, short-run deviations of the original time series from the estimated long-run trend can be used for subsequent statistical analysis (see web appendix 1). This could decouple state-specific underlying time trends in mortality from short-term trends that could relate to the Great Depression. We performed a sensitivity analysis using different smoothing parameters for estimating long-term trends (the standard is 6.25, although Granados and colleagues use 100), finding that our results did not differ qualitatively. In a short panel, the HP filter may be less accurate, as noted by Baum.45 Thus, we also replicated our analysis using short-term changes in the mortalities (using annual levels of the percentage change in mortalities). We also controlled for relatively fixed differences between states, such as geographic location by means of state dummy variables. This standard practice in health econometrics is equivalent to analysing state-specific slopes, or the variations within states over time.46
One limitation to our analysis is that the statewide data sources available for this analysis began in 1929. Because the analysis was conducted within each state, the starting-point did not necessarily affect the study's ability to identify an association between variations in bank suspensions and mortality fluctuations. We assessed alternative starting-points, such as 1930, and found that our results did not change.
Our basic fixed effects, or ‘within-state,’ regression model was thus:
Here i is the state, t is the year, and c is the cause of death; MR is the log mortality for each cause, adjusted for time trends by using the HP filter described above; BANK is the percentage of banks suspended in the current year; μ is a set of state-dummy variables; and ε is the error term.
In a subsequent step, we attempted to assess whether there were any delayed effects of bank suspensions on mortalities. This can be done using finite distributed lag models, sequentially including lags and applying Bayesian information criteria to determine the appropriate lag length. However, as we do not have strong theory to determine the appropriate lag length, as well as a relatively short time-dimension, we opt for an alternative framework using dynamic fixed-effects models (ie, auto-regressive distributed lag models) that can differentiate between immediate and delayed effects, as shown in equation 2.
This model is commonly referred to as an ‘error-correction’ model because the error of an embedded level equation (shown in parentheses), reflecting the deviation from longer-term relationships, is adjusted to a rate given by Ф. Because we are trying to disentangle short- and long-run dynamics, we used the data without detrending them (as in model 1); however, we did include a time-trend control, as is conventional procedure in these models. Thus, this model estimates both the contemporary change effects of bank suspensions and the average or long-run impact of bank suspensions over the entire period being studied (capturing any significant delayed effects).
As additional robustness checks, we corrected the data for the percentage of the state population living in urban settings, because rural–urban migration could confound results. We also adjusted for literacy and ethnicity, which were available at county level in the dataset.29 As with nearly all US-wide demographic data from this period, the population denominators of these variables were linearly interpolated for the decadal years of the US census in 1920, 1930 and 1940.
Data were analysed using the xtreg module in STATA v10.1 using option ‘fe.’ Regression models were weighted by the contribution of the state to the total US urban population. Standard errors were clustered by state to reflect non-independence of sampling and for estimating robust standard errors unbiased to potential heteroskedasticity or serial correlation.
Results
Epidemiological analysis of the immediate causes of mortality fluctuations
Table 1 and figure 2 summarises trends in mortalities due to seven specific causes of death and all causes combined, weighted by city population size. Overall, all-cause mortalities fell from 1273.4 per 100 000 in 1929 to 1148.2 per 100 000 in 1933, the lowest rate of all-cause mortality recorded during the period of the Great Depression. Table 2 decomposes the reduction in all-cause mortalities between 1929 and 1932 into specific causes of death. As shown in the table, the observed declines were mostly attributable to falls in infectious diseases, including pneumonia (−26.4% of total change in all-cause mortalities), flu (−13.1%) and respiratory tuberculosis (−11.2%), as well as congenital malformations (−11.8%) and nephritis (−9.4%).
Trends in death rates per 100 000 population by cause, weighted means, 114 US cities 1929–1937
Decomposition of immediate causes of death attributable for changes in all-cause mortalities, 1929–1933
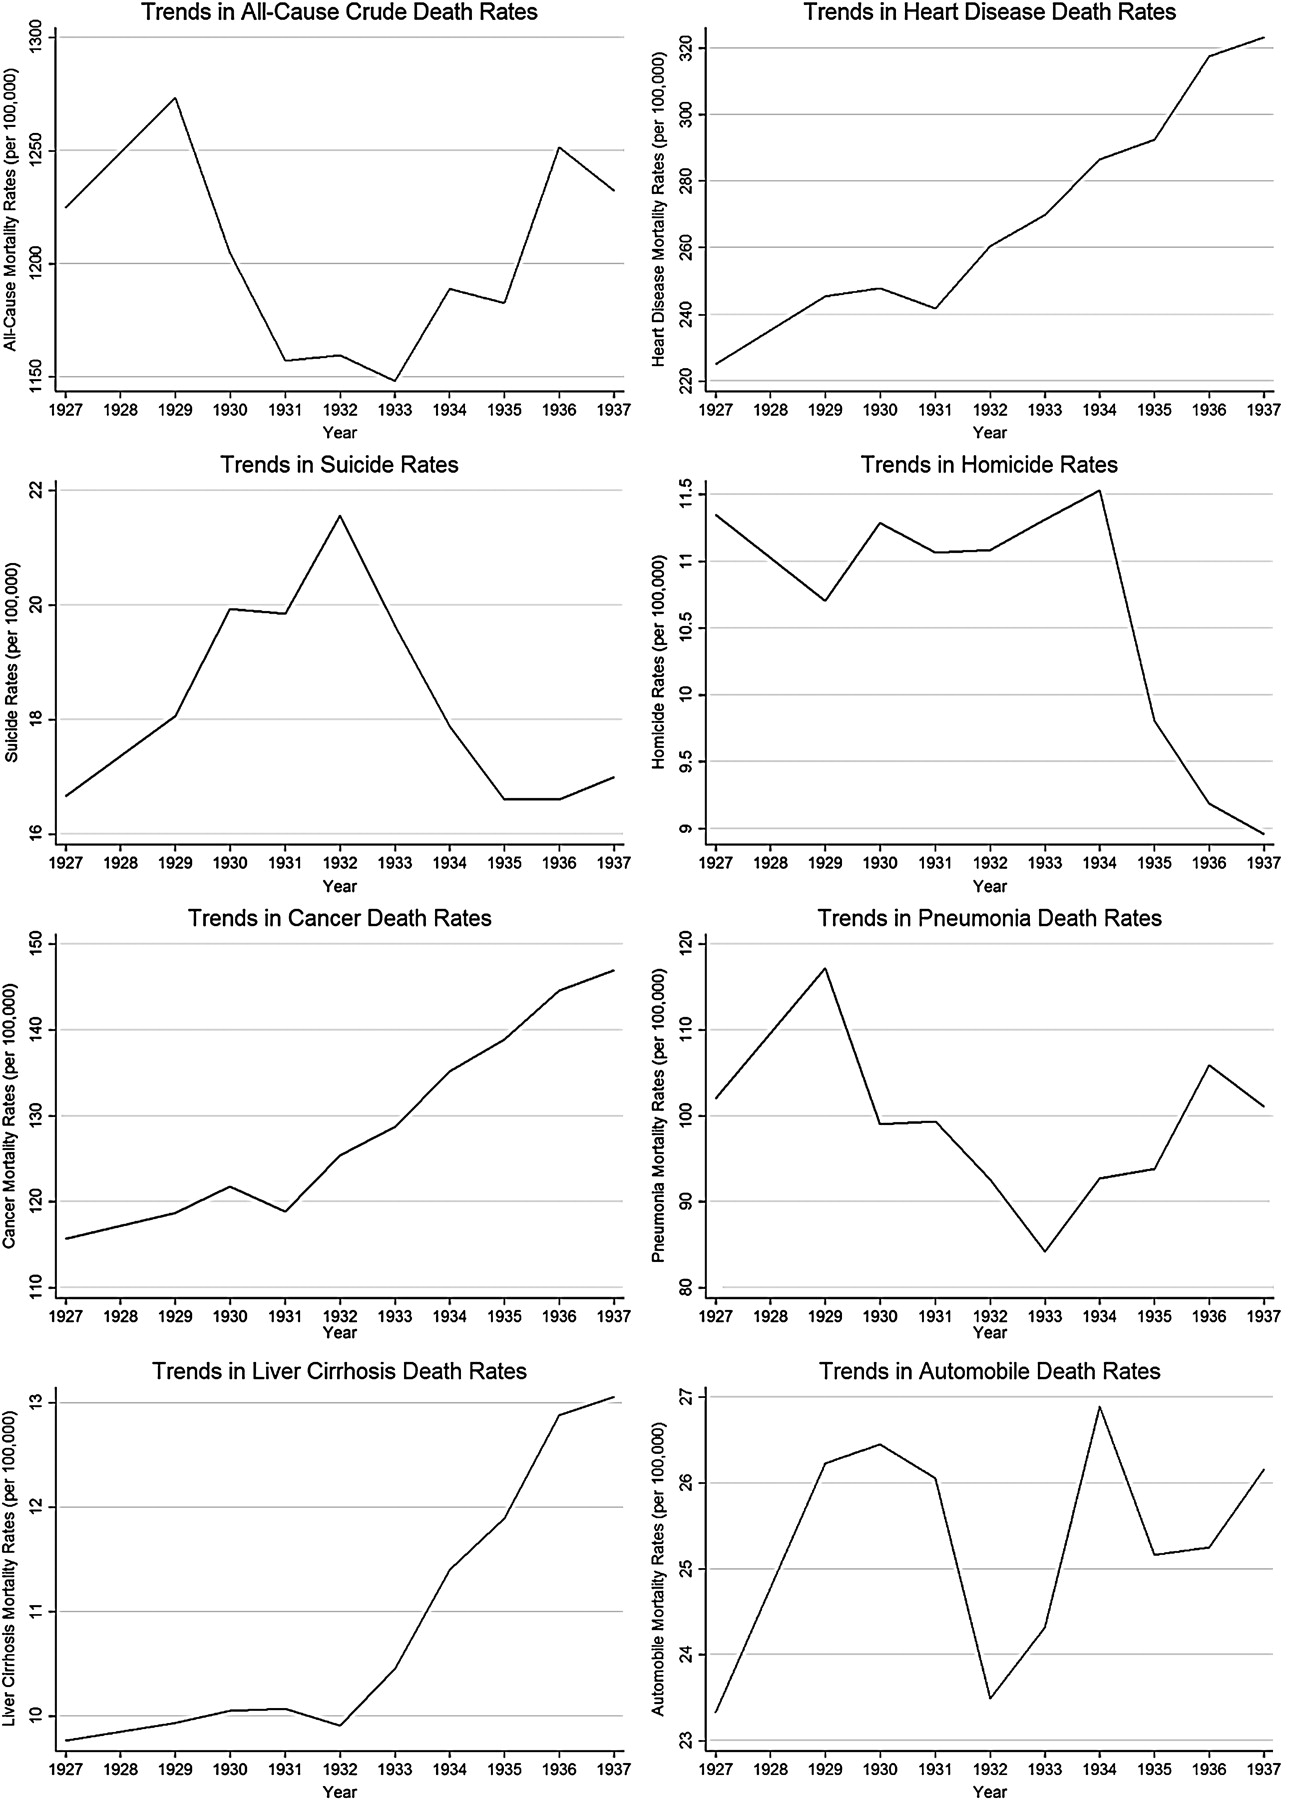
Trends in death rates from selected causes, 114 US cities, 1927–1937.
Reductions in all-cause mortalities obscure the rises that occurred in several causes of death. Consistent with longer-term patterns commonly referred to as ‘epidemiologic transition,’47 chronic non-communicable diseases and injuries tended to rise during the Great Depression. Of those causes of death which increased, the highest magnitude in percentage rises in death rates was recorded for deaths due to heart disease (19.4%), cancer (8.1%), diabetes (2.9%) and suicide (1.3%) (presented here as a fraction of the net reduction in mortalities).
Importantly, few of the main causes of mortality which fluctuated during the Great Depression can plausibly be linked to contemporary deterioration in the economy. If anything, deaths from infection might be expected to increase with impoverishment. However, heart disease and suicide rates could plausibly be linked to short-term economic shocks.
Taken together, this decomposition of the immediate causes of short term changes in all-cause mortality reveals that, whatever might be the proximal or underlying causes of mortality changes during the Great Depression, they were at most only weakly related to the economic turmoil of the late 1920s and early 1930s. One alternative possibility is, as was posited in the 1930s, that ‘the effect of the (public health) work of the last 25 or 30 years has been cumulative in nature’ (box 1).
Changes in mortalities attributable to the great depression
Next we detrended the data (as shown in web appendix 1) using the HP filter to isolate short-term fluctuations in mortalities. We then evaluated the associations of bank suspensions with this new measure of mortalities, corrected for average trends in this period.
Figure 3 presents the results of eight regression models of the association of bank suspensions with short-term changes in crude mortalities. We found bank suspensions were significantly associated with increased suicide rates (β=0.32, 95% CI 0.24 to 0.41) but reduced transport-related death rates (β=−0.18, 95% CI −0.29 to −0.07). No effect was observed on cardiovascular death rates, homicide rates, pneumonia, cirrhosis or cancer death rates. Because the population risk of deaths attributable to road traffic accidents (RTA) was 50% higher than suicides (weighted mean state death rates RTA=26.6 per 100 000 population versus weighted mean state death rates suicide=17.1 per 100 000 population), the reductions due to RTA outweighed the rises in suicides, yielding a negative net effect of bank suspensions on all-cause mortalities (β=−0.045, 95% CI −0.065 to −0.026).

Association of a 10 percentage point rise in bank suspensions with percentage changes in mortalities due to eight causes of death, 36 US states 1929–1937. Results presented from eight separate regression models. 95% CIs are shown in parentheses based on robust standard errors in parentheses, clustered by state to reflect non-independence of sampling. Mortality data adjust for time-trends using Hodrick–Prescott filter using 6.25 optimisation parameter. Regression models are weighted by state urban population as a fraction of the US urban population. Models also control for state-specific fixed effects. R2-within is the ratio of sum-of-squares-explained of the within-state variation divided by the total within-state variation.
As an alternative test, we used an intermediary measure of recessions, income per capita. Contemporary changes in bank suspensions were strongly associated with income, such that each 1% rise in bank suspensions was linked to a 1.06% percentage point drop in personal income per capita (95% CI 0.77% to 1.34%). The results of our analysis of income–mortality associations, replicating figure 3, are shown in figure 4. In this case, we detect that contemporary reductions in income levels are correlated with significant rises in cancer, pneumonia, cardiovascular disease, liver cirrhosis, suicide and homicides, but reductions in road-traffic fatalities, as noted by other scholars in this literature. The first two are biologically implausible. A death from cancer is the final event in a process that began some time earlier. This is most apparent in mortality from breast cancer, which reflects, among other factors, changes in fertility, and in lung cancer, which reflects inception of smoking, in both cases typically three to four decades previously. In the 1930s, there were virtually no clinical interventions that could influence the clinical course of cancer (surgical treatment would have prevented death in only a few per cent of cases at most), so that deterioration in the delivery of healthcare could not be expected to have a discernible impact. As with cancer, at this time there was no effective treatment for the complications of flu so, again, changes in healthcare cannot be invoked. The rise in deaths from pneumonia is, however, plausible if it is due to increases in hazardous drinking, as was seen in Russia in the 1990s,48 or associated with a deterioration in housing conditions. However, with the data available to us, it is not possible to study this further.

Association of a 10% rise in gross domestic product per capita with percentage changes in mortalities due to eight causes of death, 36 US states 1929–1937. Results are presented from eight separate regression models. 95% CIs in parentheses are based on robust standard errors in parentheses, clustered by state to reflect non-independence of sampling. Mortality data adjust for time-trends using the Hodrick–Prescott filter using 6.25 optimisation parameter. Regression models are weighted by state urban population as a fraction of the US urban population. Models also control for state-specific fixed effects. R2-within is the ratio of sum-of-squares-explained of the within-state variation divided by the total within-state variation.
Overall, a 1% decrease in GDP is associated with a 0.12% decrease in all-cause mortalities. However, once we identify those fluctuations in GDP that can be attributed to banking crisis, using a two-stage modelling approach, those spurious associations disappear, as shown in figure 5.

Association of a 10% decline in gross domestic product per capita attributable to the banking collapse with percentage changes in mortalities due to eight causes of death, 36 US states 1929–1937. Results are presented from eight separate regression models. 95% CIs in parentheses are based on robust standard errors in parentheses, clustered by state to reflect non-independence of sampling. Mortality data adjust for time trends using the Hodrick–Prescott filter using the 6.25 optimisation parameter. Regression models are weighted by state urban population as a fraction of the US urban population. Models also control for state-specific fixed effects. R2-within is the ratio of sum-of-squares-explained of the within-state variation divided by the total within-state variation.
We also assessed the potential for delayed effects of bank suspensions on mortality. Figure 6 presents the results of the dynamic fixed-effects ‘error-correction’ model. It provides several key insights. First, it shows that the short-term changes in mortality were not compensated for in the long-run. Mortalities rebounded to their long-term trend, but did not dip below it, so that the economic shock led to a permanent increase in mortality. In other words, we find evidence to refute the suggestion that people who were already at high-risk die more quickly in periods of crisis, and after they are removed from the population, mortality successfully declines, so that the long-term effect is neutral. Second, we find some evidence of delayed effects for reductions in pneumonia and liver cirrhosis; however, none of the delayed effects were qualitatively different from the immediate effects on mortality. The finding of a delayed impact on pneumonia is implausible on biological grounds, given the natural history (days) of the disease, but, given the number of statistical tests, it would not be unexpected to observe a false-positive result. Those for cirrhosis, however, are plausible.

Immediate and delayed associations of a 10 percentage point rise in banking suspensions attributable to the banking collapse with percentage changes in mortalities due to eight causes of death, 36 US states 1929–1937. Results are presented from eight separate dynamic fixed effect regression models. 95% CIs in parentheses are based on robust standard errors in parentheses, clustered by state to reflect non-independence of sampling. Regression models are weighted by state urban population as a fraction of US urban population.
As a final robustness check, we introduced a series of additional demographic control variables (web appendix 2). All of our results were similar. We noted several significant associations with our demographic control variables; however, as these data were interpolated (based on decadal intervals), their meaning is better interpreted as reflecting long-term trends. For example, we observed that states with a greater fraction of people living in cities had greater reductions in all-cause mortalities, whereas those with greater fractions of the population illiterate experienced greater rises in all-cause mortalities. This is consistent with existing work on the social determinants of health, which suggests that more urban populations could have had greater resources and access to social capital to buffer them in a crisis. The association with illiteracy also reflects the well-known educational gradient in health. Understanding the social correlates of inequalities in mortality experience during periods of crisis remains an important topic for future investigation.
Conclusion
Before discussing our findings, we must first address the study's important limitations, many relating to the historical nature of the dataset. First, if the events being studied were taking place today, there would be many more potential explanatory variables that could be studied, in particular relating to unemployment. Our challenge was to find some measure of economic shock that could be obtained at state level. This was essential to overcome the limitation of previous national research that was unable to isolate the effects of confounding factors affecting the entire country, specifically the epidemiological transition. Rates of bank suspension do have certain advantages. As we have noted above, as banks could not then trade across state borders, they provide a specific indicator of what was happening in each state. They are also highly visible indicators that the economy is in trouble, exemplified by the pictures of queues of investors outside closed banks, and they often anticipated job losses and other shocks. Thus, they are likely to have more immediate effects on behaviour than more distant measures such as economic growth. However, they also have some weaknesses. We counted the numbers of bank suspensions, and clearly banks are of different sizes, affecting different numbers of people. A quarter of banks that closed due to financial difficulties were subsequently found to be solvent or could repay their debts.49 However, this knowledge could only be obtained with hindsight and would not mitigate the psychological shock of a bank suspension. Overall, therefore, we believe that, while imperfect, bank suspensions offer the best opportunity to capture state-level effects.
Second, as with all demographic data (other than the handful of countries that track population in real time using population registers), yearly population movements were unavailable for the US cities, making the denominator used to calculate mortalities and to weight populations less reliable. However, this measurement error would bias our coefficients towards the null, making it harder to detect a significant relationship should one actually exist.
Third, we estimated a stable fraction of deaths, about 15%, classified as ‘all other causes’ during this period. We assumed that these unclassified deaths were proportionately distributed across the causes of death we studied; however, there remains potential for bias if this distribution correlates with measures of the Great Depression, a limitation of death-certification methods confronting any analysis of mortality trends during this period. In particular, concerns have been raised that flu deaths could have been misclassified as pneumonia. Paradoxically, however, although somewhat speculatively, it is plausible that death certification may actually have been more reliable at this time than now, as the autopsy rate would have been much higher, and a somewhat younger population would have fewer deaths at old age in which multiple pathology was present.
Fourth, we were unable to standardise mortalities by age, although in a robustness check we were able to adjust for the long-term trends in population age structure in regression models, finding consistent patterns. Related to this, the lack of age-specific data precluded more sophisticated analyses of underlying trends, such as age–period–cohort analysis.
Fifth, comparative state-level morbidity data were unavailable for study in this period, although there are reports that malnutrition rates rose (albeit partially offset by relief spending and food rations), with health consequences manifest in subsequent years. Indeed, the observation during the Great Depression that mortality dropped, even as health status deteriorated for millions of Americans, helped stimulate the subsequent development of measures of morbidity.24 50
Sixth, our analysis employed new methods to overcome limitations in assessing delayed effects. Whether lagged effects of recessions exist has been debated,51 52 but in the present context, it is important to note that our findings are consistent with research by Cutler et al, applying the concept of life-course epidemiology, that found no adverse consequences for those who were being born at the time.53 We also cannot exclude delayed effects on mortality arising from risk factors, such as increased adoption of smoking, which would require decades to manifest as clinical disease and mortality. This is not, however, borne out by inspection of birth cohort trends in lung cancer among men who were entering adulthood (when smoking initiation is most common) in the early part of the 20th century.54
Consistent with the recent work by Tapia Granados and Diez-Roux, we found that mortalities in US urban populations significantly fell during the Great Depression. We were able to confirm our hypothesis that, within this overall change, there were some components, such as reductions in infectious disease mortality and increases in deaths from chronic diseases that were independent of bank suspensions. Thus, these changes cannot clearly be linked to the Great Depression, although further research will be required to assess whether coexisting and related factors such as Prohibition or relief spending linked to the New Deal played a part in accelerating the decline in the former.29 Both are consistent with what has been described as the epidemiological transition, which has taken place throughout the 20th century, and can be linked to changes in living conditions, lifestyles and, later, healthcare.47 Other components were associated with bank suspensions, rising suicides and falling road-traffic fatalities. These associations meet many of the standard criteria for causality,42 including temporality, coherence, consistency (having been described in recessions over the past 30 years in high-income countries5) and biological plausibility (psycho-social stress and reduced industrial activity and discretionary road traffic respectively).
However, our study does differ from the work of Tapia-Granados that relied on aggregated data (using a total of 21 data points covering each year of 1920–1940) to infer that unemployment and declines in GDP were significantly associated with reductions in infectious diseases. For example, they estimated that a one percentage point increase in GDP was associated with a reduction in life expectancy of 0.20 years; extending that estimate to the 33% drop in GDP recorded in this period would suggest an increase in life expectancy of up to 6 years, an implausibly large estimate.
While, on the surface, the trends may appear to indicate a substantial protective effect of the Great Depression, leading some commentators to suggest that recessions could be a ‘lifestyle blessing in disguise,’ our detailed investigation of the magnitude, speed and types of health improvements that occurred during the Great Depression, as well as the statistical evidence, reveal that, in the Great Depression, these marked reductions (with the exception of road-traffic injuries) could be attributed to causes other than the financial crisis. This evidence was consistent when measuring the economic shock using bank suspensions (as a proxy for the underlying crisis) or GDP (as an intermediate measure of economic decline, stemming from the bank crisis). While the detailed analysis needed to understand the specific interventions resulting in these improvements is not possible in the scope of this article, there are several potential candidates. The two most likely are the New Deal, the expansion of financial relief to the newly unemployed, which formed the basis of the US system of social security, and Prohibition on alcohol, which had begun in 1919 but was lifted in 1933 (as part of a revenue-generation strategy). Further candidates include longer-term improvements in sanitation and hygiene, and potential advances in medical therapy resulting from sulfanomides. There is also a potential for misclassification of pneumonia deaths as flu. Also, it is possible that workers who left urban environments were exposed to less crowded factory settings, reducing high effective contact rates that are conducive to the spread of infectious diseases.
Importantly, this study shows that economic crisis does not guarantee a mortality crisis, but instead reinforces the notion that what crucially matters is how governments respond and whether protective social and public health policies are in place both during and in advance of economic shocks.5 55 56 57 However, this study cannot identify effective responses to the current economic situation, but it is of interest that many public health measures recommended as responses to the current crisis are similar to those advocated in the Great Depression. For example, William Welch, president of the American Medical Association, wrote to the New York Times, ‘Any undue retrenchment in health work is bound to be paid for in dollars and cents as well as in the impairment of the people's health generally. We can demonstrate convincingly that returns in economic and social welfare from expenditures for public health service are far in excess of their cost’ (p. 275, cited in Perrott and Collins26) and ‘Social aid and advice could save thousands yearly’ (New York Times, 14 May 1931). Strategies to make politicians more aware of the economic costs of illness were also prominent. As one public health doctor wrote to the New York Times, ‘The economic loss (due to road deaths) every year according to reliable figures is $2 500 000 000. This loss is greater than the annual sum spent on the public school system of the USA, which is $2 200 000 000’ (28 August 1932).58 A better understanding of the debates at that time and the responses mounted may offer insights into contemporary events.
Our research has implications for policy. It provides further evidence that even major depressions do not imply mortality crises. In the period studied, long-term epidemiological trends appear to have outweighed the social forces contributing to immediate fluctuations in death rates. To the extent that the ongoing 2008 crisis reflects the past, these findings suggest that, although it may increase suicides and decrease road traffic accidents, mortalities will be determined to a great extent by factors other than the extent of the underlying economic shock, including how governments choose to respond.
What is already known on this subject
Previous research using highly aggregated national data suggests the Great Depression, one of the greatest market crashes recorded, led to remarkable, albeit counterintuitive, improvements in public health.
What this study adds
Using a new historical dataset of city-level and state-level mortalities by cause and a novel measure of the cause of the Great Depression, banking crisis, the study shows that although the Great Depression was linked to rises in suicides, but falls in road-traffic fatalities across US states, overall the bulk of mortality changes was unrelated to the crisis itself.
We replicate previous analyses using intermediary measures of the economic downturn, such as income per capita, demonstrating that spurious correlations would arise because these measures correlate with long-term trends (such as epidemiological transition), whereas bank suspensions do not. Once we correct this long-term association, we show that the biologically implausible short-term associations (such as with cancer) reported in the cyclical-mortality literature disappear.
Using a new dynamic model that can disentangle immediate and delayed effects of the crash, the study finds no evidence of significantly delayed effects of the economic shock on mortality (at least up to the late 1930s), consistent with smaller-scale cohort studies of this period.
Overall, the study calls into question existing analyses of the Great Depression that concluded the crisis per se led to major short-term improvements in health. Future work is needed to understand the potentially protective effects of the New Deal and Prohibition.
Acknowledgments
We are grateful to J Tapia-Granados for a series of constructive comments and criticisms on various drafts of this paper.
References
Footnotes
Competing interests None.
Provenance and peer review Not commissioned; externally peer reviewed.