Article Text

Abstract
Background The potential for natural environments to be salutogenic has received growing interest from epidemiologists, but there has been no critical examination of the extent to which associations between green space and health might vary according to the indicator of green space coverage used.
Methods Three different indicators of green space coverage were derived for a set of 268 small areas in four cities within Britain. The indicators had different origins and provided a spectrum of sensitivity from larger spaces only, through to ambient greenery. Two indicators reproducible for anywhere in Europe were included. Agreement between the indicators on the quantity of green space in a small area, and their independent association with measures of mortality and self-reported morbidity, were compared.
Results Overall, the indicators showed relatively close overall agreement (all r2>0.89, p<0.001). However, agreement varied by level of area socioeconomic deprivation (p<0.001). The indicator that detected larger spaces only found less green space in areas of socioeconomic deprivation than the other two. Despite this difference, all indicators showed similar protective associations with the risk of mortality and self-reported morbidity suggesting that larger green spaces may be more important for health effects than smaller spaces.
Conclusions Associations between green space indicator and health were not sensitive to indicator origin and type. This raises the possibility of trans-European epidemiological studies. Larger green spaces may be the most important for health effects, but may also be less prevalent in more deprived areas.
- Environmental epidem
- green space
- indicator
- measurement
- methodology
- methodology me
- urban health
Statistics from Altmetric.com
The potential for contact with natural environments such as parks, forests and river corridors to be salutogenic has received recent and growing interest from epidemiologists. Several experimental studies have suggested that exposure to green spaces (either physical or visual) can stimulate recovery from stress and mental fatigue, reduce blood pressure,1–3 and may accelerate healing in patients after surgical intervention.4 Evidence from large-scale population studies is now beginning to emerge, finding a lower risk of self-reported poor health and reduced socioeconomic health inequalities among populations exposed to greener local environments.5–12
There has been tremendous variety in the sources, scales and styles of green space indicator used in this epidemiological work. We might expect that the indicator of green space used will influence the results obtained. Studies in The Netherlands by De Vries et al8 and Maas and colleagues,5 13 for example, defined exposure by the percentage of green space land cover within a set distance of a person's place of residence, using data accurate to 25 m2 extracted from the National Land Cover Classification database.14 Mitchell and Popham's work on England9 10 and Richardson and Mitchell's work on the UK11 was based on estimates of the percentage green space for predefined geographical boundaries, derived from detailed map datasets. Richardson et al15 derived a measure of exposure to green space for all urban New Zealand based on national administrative records of land classification, whereas Jones et al16 used local administrative records for a local study. Other studies12 17–19 have utilised survey-based designs, often relying on self-reported indicators of exposure and smaller geographical coverage compared with population-level epidemiological studies. Most epidemiological work has examined urban populations and, where the measures of green space were ecological, small areal units were used to define exposed populations and to measure exposure. By definition, urban areas are not dominated by natural environments and the significance of visual and physical access to them may be heightened.20
The literature shows variety in effect sizes detected. To date, there has been no critical examination of the extent to which associations between green space and health might vary, or might even be determined, by the indicator used. Understanding how definitions of green space, and measurement of exposure, impact on results is important if we are to (1) deepen our understanding of the mechanisms by which exposure to green spaces may be salutogenic, (2) determine the importance of any effects for population health and health inequalities and (3) begin to compare relationships between green space and health internationally. This last point is important. Most epidemiological studies examining the relationships between green space and health have stemmed from northern European nations, which, to some extent, share environmental and cultural characteristics. Emerging literature suggests that associations in other countries and settings may be different.15 If we can establish the extent to which associations may depend on the measure of green space used, or even identify a reliable measure that is available for several countries with differing environmental and cultural characteristics, this could open the way to international comparison work.
Responding to the absence of work addressing this issue, our research questions were: (1) To what extent do green space indicators derived from different data sources tend to agree about the quantity of green space in small urban areas? (2) Do associations between green space exposure and health vary according to the origins of the green space indicator and, by proxy, the type of green spaces captured by the indicator?
Methods
Study design
Three different indicators of green space coverage were derived for the same set of small areas within Britain. The extent to which they agreed on the quantity of green space and in their independent association with measures of mortality and morbidity was examined. The indicators were sensitive to different sizes and configurations of green space, characteristics we refer to as ‘type’ of space.
Study area and spatial units
The study was carried out on 286 small areas, which constituted four British cities. The cities of York, Exeter, Edinburgh and Glasgow have contrasting geography and population size. This was a purposeful sample, which included a manageable number of small areas, cities that were known to us personally (enabling visual appraisal of mapped green space data), yet a range of city sizes, urban structures, histories, population densities and settings (table 1). Glasgow is a large post-industrial city, well known for having very poor public health, highly deprived suburbs, but a leafy and affluent ‘west end’. Edinburgh is famed for its historical layout, architecture and affluence, but has problematical peripheral housing estates. York is a smaller city than Edinburgh or Glasgow, with a similar historical city centre to Edinburgh, though bisected by a river. Exeter is the smallest of the four cities, comparable in size to a large market town with a mix of moderately affluent and moderately deprived populations. The definition of small area in this study was a census area statistic (CAS) ward, a small geographical unit used in the administration of the UK census. CAS wards offered a balance between the need for a relatively small unit to represent neighbourhood exposure to green space and the requirement for units that are sufficiently sized to permit robust analyses of any association between green space and health.11 The CAS wards within the four cities had a mean area of 2.7 km2. The study population was 1 625 495.
Study population
Green space indicators
The first indicator was derived from the Coordination of Information on the Environment (CORINE),21 available from the European Environment Agency. CORINE is a decennially released land cover inventory of remotely sensed satellite imagery spanning the whole of Europe.21 We used the data from 2000. Its classification of land cover has 46 categories ranging from urban green spaces to dense urban fabric and industrial land use. We selected all 22 CORINE land cover categories pertaining to natural, land-based (ie, excluding water bodies) environment to produce an indicator of green space. CORINE's structure imposes a 25 hectare minimum area on green spaces, which can be separately identified. This means CORINE is sensitive only to larger contiguous green spaces such as parks; smaller spaces that may contribute towards the overall ambient ‘greenness’ of urban neighbourhoods were not included.21
The second indicator was derived from the British Ordnance Survey's master map (OSMM). The OSMM is an extremely fine-scaled source of geographical information for Britain.22 OSMM data are captured at a scale of 1:1250 in urban areas, giving a 95% CI of 1 m around any point. The features are derived from aerial photography with a 25 cm resolution, ensuring that very small features can be identified. OSMM is compiled and updated by ground and aerial surveys, most features in our set were updated in 2005. OSMM contains a topography layer, which is delimited into nine themes, two of which were used for defining green space: (1) the terrain ‘natural’ subset, representing all natural (non-synthetic) topography; and (2) water (to include small ‘blue spaces’ such as river corridors). The aggregation of these themes produced a dataset capable of identifying very small green spaces and, in contrast to CORINE, an indicator sensitive to the overall ‘green ambience’ or ‘greenness’ of each small area. While OSMM is available for all of Britain, access constraints prevented the data being obtained for all cities. We were able to access it for the four cities in our study.
The third indicator was a ‘hybrid’ designed to offer a middle ground between CORINE (sensitive to larger spaces only) and OSMM (sensitive to ambient greenery). Production of the Hybrid indicator is described in detail elsewhere.11 Briefly, we adjusted CORINE's estimates to increase sensitivity to smaller areas of green space, using data derived from OSMM and the UK census. England is fortunate enough to be covered by the generalised land use database (GLUD).23 This provided an estimate of the proportion of each small area covered by green space and is essentially derived from OSMM. However, it had none of the access restrictions to which OSMM is subject. We created a regression model for all small areas in England in which 2001 GLUD percentage green space values were predicted by a combination of CORINE components (including ‘discontinuous urban fabric’, which recognises less dense built environments) and census-based measures of housing density. The model replicated GLUD very well (R2=0.940, p<0.001). We used this model to produce green space estimates for all small areas in Britain; the Hybrid dataset, which can be characterised as being of an intermediate level of accuracy, between OSMM and CORINE. We extracted Hybrid estimates for our sample of small areas. This process of adjusting CORINE to be more sensitive is reproducible anywhere in Europe where housing density data are available.11
A geographic information system was used to match the CORINE and OSMM data to CAS wards. The percentage of the land area of each ward identified as green space by the dataset formed each indicator.
Health and covariates
Two measures of health; self-reported morbidity and all-cause mortality (excluding external causes) were used; these both provided sufficient incidence for statistical power in this smaller sample and have proven association with green space in a UK setting.9 10 Respondents to the 2001 UK census were asked whether their health had been ‘good’, ‘fairly good’ or ‘not good’, over the previous 12 months. In line with previous analyses,5 9 13 we counted the number of ‘not good’ responses. Morbidity data were available for everyone in the sample. Anonymised, individual mortality records were obtained from the Office for National Statistics and General Register Office for Scotland GRO(S). The records covered every death registered and matched to a ward between 2001 and 2005. All-cause mortality, excluding external causes, was measured using International Classification of Disease, version 10 codes A00–R99.
Reliable individual-level measures of socioeconomic status for the mortality and morbidity cases were not available. We therefore measured deprivation at ward level using the income deprivation domains from the indices of multiple deprivation calculated for Scotland and England. This measure provided the proportion of the population of an area experiencing income deprivation (ie, percentage of the population that is receiving financial support from the government because they have a low income and additionally are either: unemployed and looking for work; not available for full-time work; aged 60 years or over; responsible for at least one child). Higher scores on the income deprivation measure indicated relatively higher levels of area deprivation. We also adjusted our analyses for population density, to allow for any influence of settlement density not related to green space, for age and sex and for air pollution. By controlling for air pollution levels, we reduced the likelihood that any reduction in risk of poor health due to the lower air pollution levels that characterise greener areas became wrongly attributed to higher levels of green space. The average concentration of particulate matter with a median diameter less than 10 μm (PM10) between 1999 and 2003 was calculated for each ward. All analyses were based on respondents aged 65 years and under to focus on a population with premature morbidity or mortality and to remove any influence of health-related migration in old age. All models controlled for age and sex of the exposed populations.
Analyses
To answer research question 1, we compared the values of green space indicators for each ward using scatter plots, bar graphs and correlation. We explored differences in mean agreement between all possible pairs of indicators across socioeconomic groups, using analysis of variance. We examined any spatial patterns in agreement or disagreement between the indicators by mapping them using Esri's ArcMap software.
To answer research question 2, we used negative binomial regression to explore the associations between green space and morbidity or mortality. As the associations between green space and health were not linear we categorised each green space indicator variable at 20% intervals (ie, 0–19%, 20–39%, etc). For the same reason, we treated income deprivation and age group as categorical variables, using quintiles of the former (calculated nationally) and 15-year age groups. We ran separate models for each combination of green space indicator and health outcome. Negative binomial models were used instead of Poisson because the health data were overdispersed. Our models utilised robust standard errors to allow for spatial clustering.24 25 Models were run using Stata version 10.
Results
The three indicators of green space exposure showed strong positive associations (figure 1, table 2). However, CORINE had a tendency to report near zero levels of green space for some areas in which the other two indicators found higher levels. Other measures of agreement between the indicators are also shown in table 2, including the mean and maximum differences between the amount of green space in a ward when measured by paired comparisons of the indicators. Some maximum differences were quite large, with a maximum difference of 49.03 percentage points between CORINE and the Hybrid indicator, for example. However, the means and standard deviations of disparities between the indicators were much lower, suggesting a small number of outliers. Table 2 suggests differences between the Hybrid and OSMM indicators were the smallest.

Scatter plots comparing the green space values captured by each indicator (axes show percentage green space in the ward, dots are wards in the study). CORINE, Coordination of Information on the Environment; OSMM, Ordnance Survey's master map.
Relationships between the three green space indicators
Figure 2 illustrates spatial differences between the green space indicators for one city, Glasgow. The maps show a high level of agreement between the OSMM and Hybrid indicators, but the tendency for CORINE to indicate lower levels of green space is evident. When considering all three cities, there was no apparent spatial patterning to wards in which the indicators disagreed about the levels of green space; they were not particularly peripheral or central.
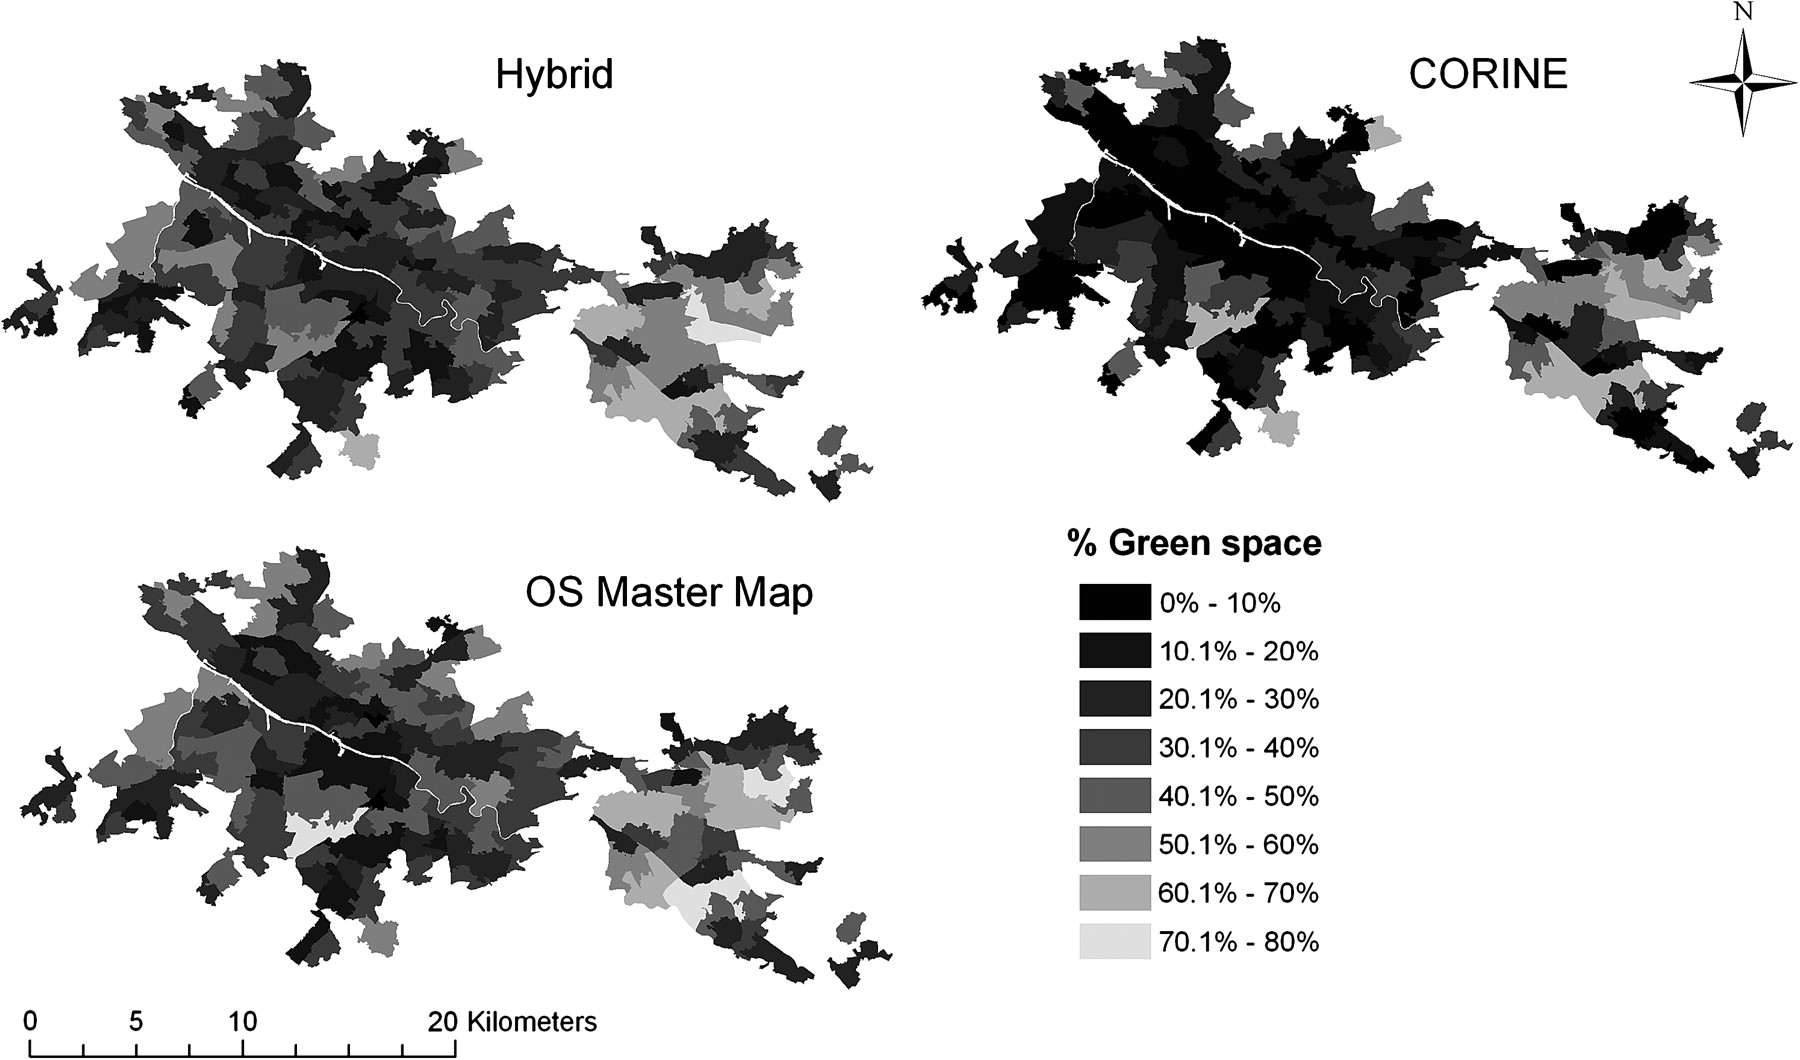
Distribution of green space in Glasgow, as detected by three different indicators. CORINE, Coordination of Information on the Environment; OS, Ordnance Survey. This work is based on data provided through EDINA UKBORDERS with the support of the ESRC and JISC and uses boundary material which is copyright of the Crown and the Post Office. Master Map ©Crown Copyright/database right 2009. An Ordnance Survey/EDINA supplied service. CORINE (c) EEA, Copenhagen (2001).
There was no association between ward size and indicator agreement, or between population density and indicator agreement (data not shown). However, we did observe positive associations between the size of disparities among the three measures of green space and the level of income deprivation in the ward. Figure 3 shows that the tendency for CORINE to detect lower amounts of green space than OSMM and Hybrid increased with increasing income deprivation. Mean OSMM and Hybrid scores were notably close and their agreement did not significantly vary by income deprivation quintile. Levels of green space detected by CORINE and Hybrid were weakly inversely associated with income deprivation; poorer areas tended to be less green (r2=−0.25, p<0.001 and −0.17, p<0.005, respectively). This was not the case for the OSMM measure (r2=0.12, p>0.05).
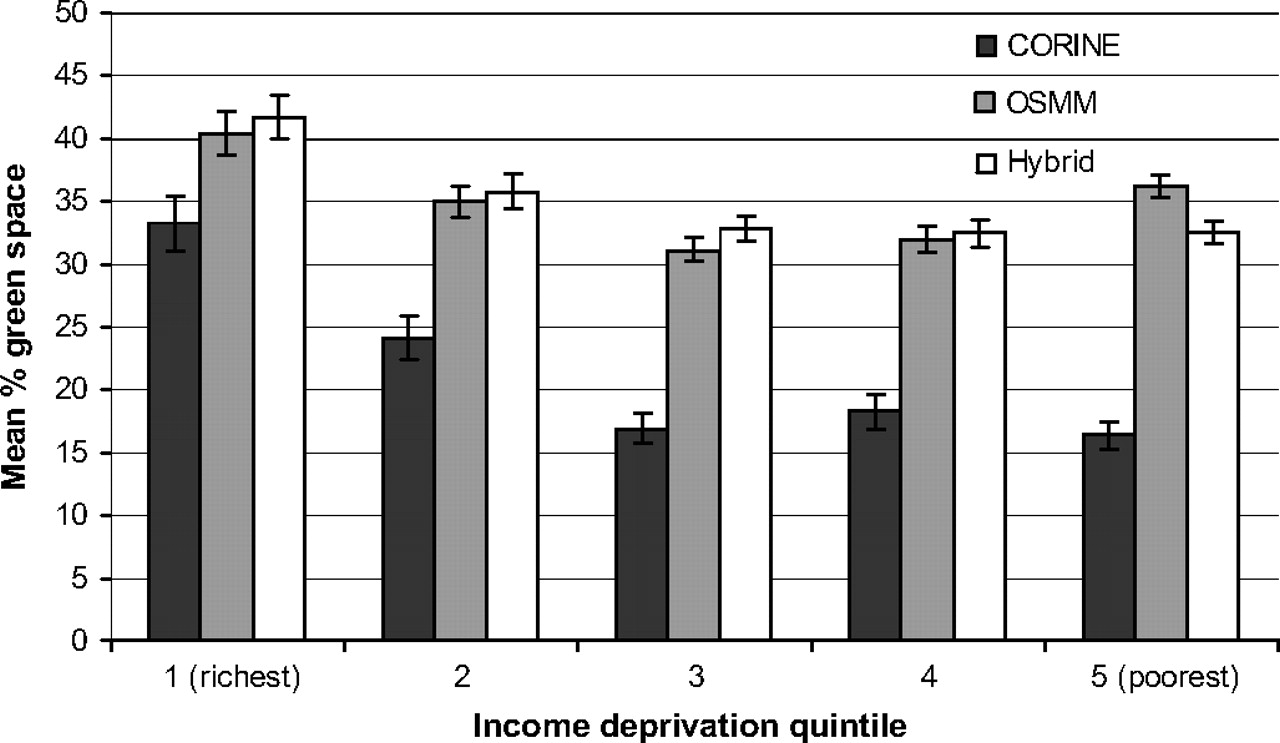
Mean green space levels for wards stratified by socioeconomic deprivation, with 95% CI. CORINE, Coordination of Information on the Environment; OSMM, Ordnance Survey's master map.
Results from the negative binomial regression models are shown in figure 4. The incidence rate ratios express the risk of death or morbidity relative to areas with less than 20% green space. Ratios below 1.0 indicate a reduced risk of either all-cause mortality or self-reported morbidity (ie, they denote relatively better health). A significantly lower risk of all-cause mortality (excluding external causes) was observed in areas with more than 60% green space. More importantly, the associations between all-cause mortality and the three indicators were broadly similar in magnitude and direction. There was also a significantly lower risk of self-reported morbidity associated with green space at levels greater than 80% and, again, the patterns of association varied little between green space indicators.

Incidence rate ratios (IRR) with 95% CI, for the association between green space and all-cause mortality (excluding external causes) and self-reported morbidity. CORINE, Coordination of Information on the Environment; OSMM, Ordnance Survey's master map.
Discussion
Three indicators of green space showed reasonable agreement in terms of the quantities of green space detected in small areas within four British cities. All indicators displayed similar associations with the risk of all-cause mortality (excluding external causes) and self-reported morbidity, after controlling for confounders. Considering the markedly different methodologies and sources behind these datasets, the general agreement in both measurement and association with health was comforting for a field of research that has hitherto paid scant attention to variation in green space measurement from study to study.
The degree of exposure for some wards and settings was shown to vary quite considerably between each of the indicators used in this study. CORINE detected less green space in more deprived wards (figure 3). CORINE also had a tendency to indicate zero green space for some areas shown by the other indicators to have higher levels (figure 1). These results are a consequence of CORINE's sensitivity to larger spaces only. Figure 4 therefore suggests that more deprived populations tend to have less exposure to larger green spaces.
Such differences in sensitivity to different kinds of green space are important when related to the mechanisms by which green space may be salutogenic. If green space has the greatest influence on health via restorative properties,26–28 and thus contact with nature, rather than physical activity in it, is more significant, an indicator sensitive to ambient green space (such as road side trees, and small lawns) might be important. If the contact with green space necessary for health benefits requires larger spaces, either for exercise or more complete immersion in nature, larger parks or woodlands might be important, in which case CORINE would be useful. The extent to which CORINE ‘underestimates’ green space, or simply captures ‘the green spaces which have health benefits’, thus depends on the mechanisms by which green space influences health. These mechanisms remain underresearched. It may, for example, be possible to develop indicators of green spaces likely to be salutogenic by a specific mechanism. Opportunities for physical activity may be limited in a small public garden for example, but promoted by open playing fields. If a number of mechanism-specific indicators were developed, comparison of their association with health may provide useful perspectives on which mechanism(s), and spaces, matter most for health.
Associations with all-cause mortality and self-reported morbidity confirmed those found in previous studies, but it is important to note that the indicators did not differ markedly in their associations with two measures of health. In one sense it seems not to matter how the quantity of green space is measured; any one of our indicators could have been used in an analysis of the association between the quantity of green space and health and produced the same substantive result. As CORINE is sensitive to larger spaces only, the similar association between health and green space for all three indicators raises the possibility that it is the larger green spaces that hold most influence on health. If smaller spaces or ambient greenery held the greater influence, we would have expected to see weaker associations between CORINE and health. The datasets and study design used here cannot provide a definitive perspective on this question, but the intriguing result begs further investigation.
Strengths and weaknesses
This study is the first to compare three different indicators of green space for the same small areas to determine their relative level of agreement. The analyses of associations between green space and health used a robust and well-validated modelling approach, and high quality health data. CORINE and OSMM are high quality and well-validated data sources. Using two indicators potentially reproducible across Europe opens the way to international comparisons of the association between green space and health using the same measure of green space exposure.
However, the study did have weaknesses. Focusing on a sample of cities was informative about the accuracy of green space measurement achieved, but reduced power. Our city sample was purposeful and not random. It is probable that we did not encompass the entire range of urban and suburban environments in Britain, and results might be different for other towns and cities. The OSMM data used were from a slightly later time period than the other two indicators; it is possible (although highly unlikely) that differences in the green space detected were due to land cover change. Our results do not prove any causal relationship between green space exposure and health because the data were cross-sectional. Exposure misclassification through migration is a distinct possibility, as is the selective migration of a healthier, more active population to greener neighbourhoods. The range of confounders adjusted for was also narrow and did not include smoking for example.
As with previous analyses,5 8–11 this study suffered from the ecological fallacy in that our approach assumed all people have equal access to the green space available within the ward of residence. We had no way of knowing if, and for which segments of the population, this was true. We could not distinguish between public and private green spaces, for example, so it would be possible for our indicators to have identified a very green ward, but for that green space to be private and thus for most residents to be unable to access it. Measures of green space quantity are, arguably, a rather crude proxy for the contact (visual or physical) that is required for salutogenic effects to follow. However, while these issues threaten any robust conclusions about the association between green space and health, they do not threaten our conclusion that the associations with health were similar for all indicators.
Finally, as in much of the literature, we lacked information on the quality of space that might influence the level and type of use. However, quality is notoriously difficult to measure as perceptions of it are likely to vary by user type and preference. A comparatively wild space suitable for deep contact with nature might be rated as high quality by a lone walker, for example, but of poor quality by a parent wanting to visit nature with their young children.
Conclusion
Different indicators of green space exposure, with different origins, demonstrated reasonably consistent assessments of exposure overall and evidence of independent associations with mortality and morbidity. The study opens the possibility for UK and Europe-wide epidemiological studies, using consistent green space indicators. The study also raises the possibility that it is larger green spaces that are most important for protecting and improving health.
What is already known on this subject
Contact with green spaces (such as parks, forests and river corridors) is associated with both individual and population-level health benefits.
Although epidemiological studies are emerging on this subject, there has been no exploration of how the green space indicator used in the research might affect the results.
What this study adds
Three different green space indicators, with different origins and definitions, showed considerable agreement on the amounts of green space they detected and in their association with mortality and morbidity; in one sense it does not seem to matter what kind of indicator we use to measure the quantity of green space in a neighbourhood.
However, the indicators did disagree in more socioeconomically deprived areas, and this is probably because such areas have fewer larger green spaces. Results suggest that larger green spaces may be more important for health effects than smaller spaces.
Acknowledgments
The authors are grateful to the three anonymous reviewers.
References
Footnotes
Funding The authors gratefully acknowledge funding by the Forestry Commission. The funders had no sight of this article until after submission. They have had no input at all to the research process or reporting of this project.
Competing interests None.
Provenance and peer review Not commissioned; externally peer reviewed.