Article Text

Abstract
Objective Coeliac disease is defined by gluten responsiveness, yet there are few data on gluten challenge (GC) in adults on a gluten-free diet. Lack of data regarding the kinetics of responses to gluten is a limitation in clinical practice and research when GC is performed.
Design 20 adults with biopsy-proven coeliac disease participated. The study included two run-in visits followed by a 14-day GC at a randomly assigned dose of 3 or 7.5 g of gluten/day. Study visits occurred 3, 7, 14 and 28 days after starting GC. Duodenal biopsy was performed during the run-in and at days 3 and 14 of GC. Villous height to crypt depth ratio (Vh:Cd) and intraepithelial lymphocyte (IEL) count/100 enterocytes were measured by two pathologists. Antibodies to tissue transglutaminase and deamidated gliadin peptides, lactulose to mannitol ratio (LAMA) and symptoms were assessed at each visit.
Results Significant reduction in Vh:Cd (2.2–1.1, p<0.001) and increase in IELs (32.6–51.8, p<0.001) were seen from baseline to day 14. Antibody titres increased slightly from baseline to day 14 of GC but markedly by day 28. LAMA did not change significantly. Gastrointestinal symptoms increased significantly by day 3 and returned to baseline by day 28. No differences were seen between the two gluten doses.
Conclusions 14 day GC at ≥3 g of gluten/day induces histological and serological changes in the majority of adults with coeliac disease. These data permit accurate design of clinical trials and indicate that many individuals will meet coeliac diagnostic criteria after a 2-week GC.
Clinical Trials Registration Number http://clinicaltrials.gov # NCT00931892.
- Coeliac disease
- gluten challenge
- histology
- transglutaminase
- symptoms
Statistics from Altmetric.com
Significance of this study
What is already known on this subject?
-
Gluten challenge is used clinically in cases where coeliac disease is indeterminate and in evaluation of new therapeutic agents.
-
Classical gluten challenge requires consuming >10 g of gluten per day for 8 weeks, but is poorly tolerated.
-
Little is known regarding early changes which occur in adults with coeliac disease undergoing gluten challenge.
What are the new findings?
-
Over 75% of adults will meet diagnostic criteria for coeliac disease after a 2-week gluten challenge.
-
Antibody response in coeliac disease is delayed in comparison with measurable histological changes.
-
Coeliac serological titres continue to rise significantly after the end of gluten challenge.
-
No differences were seen between 3 and 7.5 g of gluten per day suggesting that high doses of gluten exposure are not routinely needed.
How might it impact on clinical practice in the foreseeable future?
-
Gluten challenge done for coeliac disease diagnosis may be abbreviated in many patients improving tolerability.
-
These data additionally will be valuable in the effective design of future coeliac clinical trials.
Introduction
Coeliac disease is a systemic immunological disorder in which the sentinel lesion is an enteropathy triggered by ingestion of storage proteins (gluten) in wheat, rye or barley.1 ,2 Ingestion of these proteins leads to antigenic presentation of certain gluten peptides that resist intestinal digestion and are antigenically presented to intestinal T cells in genetically predisposed individuals carrying HLA DQ2 or DQ8. T cell activation is considered the major cause of the mucosal inflammation and tissue destruction observed in coeliac disease which frequently results in diarrhoea and a spectrum of other gastrointestinal symptoms, increased intestinal permeability, malabsorption, occult gastrointestinal bleeding, and is associated with systemic manifestations including secondary autoimmunity, infertility, dermatitis herpetiformis and malignancy.1 ,2
The past decade has witnessed a remarkable increase in physician and patient awareness of coeliac disease due in part to the availability of simple and accurate serological screening in the form of antibody to tissue transglutaminase (tTG).3 Based on serological studies, the prevalence of coeliac disease in the USA and Europe ranges between 1:250 and 1:67.4 A growing body of literature supports the conclusion that coeliac disease is a common entity in diverse populations across the globe.
While we have an excellent understanding of coeliac disease pathophysiology,5 ,6 diagnosis,3 clinical manifestations1 ,2 and response to gluten withdrawal,7–11 there are few data on response to gluten challenge, particularly in adult patients.12 ,13 Past research on gluten exposure in individuals with coeliac disease has focused primarily on determining safe levels of gluten exposure,14 ,15 on gluten stimulation in vitro16–19 or under other laboratory conditions.20 These past studies have been vital in advancing coeliac disease management; however, the absence of studies that rigorously quantify responses to gluten challenge is a limitation for a number of reasons. In clinical practice, adherence to a gluten-free diet improves the majority of symptoms and leads to improvement or normalisation of all standard diagnostic tests including serological tests and intestinal histology. As a result, individuals with suspected but undocumented coeliac disease already adhering to a gluten-free diet cannot be accurately diagnosed, since they cannot be differentiated from healthy individuals. Thus, the standard of care in such cases is to perform a ‘gluten challenge’ whereby the patient consumes the equivalent of two servings of gluten containing foods per day for up to 8 weeks, and then returns for serological testing and duodenal biopsy.21 Gluten challenge of this dose and duration often produces unacceptable symptoms, and many patients are resistant to this approach that calls for sustained gluten ingestion for several weeks. Further, it is likely that the full 8 weeks of gluten challenge is unnecessary in a substantial proportion of patients. In addition, many recent and ongoing trials of novel coeliac therapies rely on gluten challenge for initial assessments of efficacy, but accurate study design is not possible without systematic data on the effects of gluten challenge on currently available end points. For these reasons, a better understanding of the kinetics of serological and histological changes which occur with gluten challenge is needed.
The aim of our study was therefore to evaluate the time course of serological and histological changes that occur in adults with biopsy proven coeliac disease undergoing a 14-day gluten challenge.
Methods
Subjects with biopsy proven coeliac disease in remission were enrolled. Remission was defined as: (1) Immunoglobulin (IgA)-tTG levels within normal limits (<10 ELISA units, Bindazyme, The Binding Site, Birmingham, UK), (2) on a strictly gluten-free diet for at least 12 months with a Celiac Dietary Adherence Score22 of <18 and (3) absence of both symptoms typical of coeliac disease and symptoms which prompted initial diagnosis in the participant. Documented history of positive coeliac serology at diagnosis was not required for inclusion. Participants were excluded from the study if there was a history of food intolerances other than to gluten and lactose, any food allergy, a history of severe acute symptomatic reactions to sporadic gluten ingestion, a history of chronic active gastrointestinal disease other than coeliac disease, or exposure to corticosteroids or other immunosuppressive agents within the prior 3 months.
Participants meeting inclusion criteria were randomised into a low gluten group taking two slices of wheat bread per day (3.04 g of gluten) and a high gluten group taking five slices of wheat bread per day (7.6 g of gluten). Bread was procured from a standard source and gluten dose tested using the RIDASCREEN Gliadin R5 antibody ELISA.23
The study included a 14-day run-in period followed by 14 days of gluten challenge and a final visit 14 days postgluten challenge. Study visits took place on day 14, day 0 (the day before initiation of gluten challenge), day 3, day 7, day 14 and day 28. The screening visit (visit 1, day 14) included medical history, physical examination, urine βHCG for female subjects, coeliac HLA testing preformed by high resolution PCR using commercially available sequence specific primers (DQB1 and DQA1: Invitrogen, Carlsbad, California; DQB1: Biotest Diagnostics Denville, New Jersey, USA), total IgA level and testing of IgA anti-tTG and IgA/IgG anti-deamidated gliadin peptides (DGP) (normal range <20 ELISA units for both assays, Quanta-lite, Inova Diagnostics, San Diego, California, USA) and finally non-sedated upper endoscopy with duodenal biopsy. The Bindazyme assay noted above was used for study inclusion only, all data presented utilise Quanta-lite, Inova Diagnostics. Visit 2, on day 0, included serological testing and dispensing of bread. Beginning on day 1 with breakfast, subjects were instructed to begin the assigned gluten challenge. Other than the dispensed bread, subjects were instructed to remain on their gluten-free diet throughout the duration of the trial. Blood for serological testing and urine for lactulose to mannitol ratio (LAMA, described below) were collected at each visit. Visits 3 (day 3) and 5 (day 14) also included repeat non-sedated upper endoscopy with duodenal biopsy. All visits included assessment of symptoms over the past 24 h using both the Celiac Symptom Index24 (CSI) and Gastrointestinal Symptom Rating Scale25 (GSRS). Visits 1, 3, 4 and 5 included a 24 h diet recall with a registered dietician to assess compliance with gluten challenge.
Ten duodenal biopsies were obtained at each endoscopy using a paediatric endoscope (Olympus GIF-N180) and standard disposable biopsy forceps (Olympus FB-241K). Biopsies were stained with H&E and evaluated independently by two experienced, fellowship-trained, gastrointestinal pathologists (RN and JG) who were blinded to subject identity, gluten dose group and study visit. On the best oriented section of each biopsy fragment, villous height to crypt depth (Vh:Cd) ratio was determined by measuring the mean height/mean depth of adjacent villi/proliferative crypt zones at magnification 100× and villous lymphocyte infiltration was recorded at magnification 400× as number of intraepithelial lymphocytes (IEL count) per 100 enterocytes. Following the independent slide review, one of the study pathologists (RN) reviewed assessments of Vh:Cd and IEL counts from both of the study pathologists to assess for interobserver variability. Evaluations were considered discrepant if Vh:Cd differed by more than 0.5, and IEL counts were considered discrepant if a difference of >10 IELs existed between counts. Overall, there was excellent concordance with the evaluations of the 165 biopsy fragments determined to be optimal for evaluation. No cases were discrepant with regard to Vh:Cd and nine biopsies had discrepant IEL counts with the average difference being 12±1.2 IELs. In the case of the nine discrepant biopsies, a mean IEL count between the two study pathologists was reported for the given biopsy fragment. The Vh:Cd ratios and IEL counts on individual biopsies from a single endoscopy were averaged to produce a representative Vh:Cd ratio and IEL count for each endoscopy. Normal Vh:Cd ratio was regarded as 3:1 or greater.26 Marsh–Oberhuber classification27 was reported for all biopsies on visit 5, day 14 of gluten challenge.
LAMA evaluation has been reported to be an accurate measure of small intestinal mucosal permeability though assessment of differential absorption of lactulose and mannitol.28 ,29 For LAMA testing, a solution containing 7.5 g lactulose and 2 g mannitol in 100 ml of water was ingested by participants in the evening after visit 1 and in the evening before each other study visit. The participants were asked to fast for at least 4 h and to void completely before drinking the sugar solution, then fast overnight and collect all overnight and morning urine. Urine samples were analysed for lactulose and mannitol using standardised methodology by liquid chromatography-tandem mass spectrometry (Mayo Immunochemical Core Laboratory, Rochester, Minnesota, USA).30
Changes in outcomes over the course of the study were analysed using repeated measures analysis with Greenhouse-Geisser correlation when data violated sphericity assumptions. Comparison between participants used Fisher's exact test and Student t test as appropriate. Correlations between independent study end points and between study end points and clinical and demographic variables utilised Pearson or Spearman correlation coefficients as appropriate with a p value set at 0.05.
Results
Twenty-one subjects were enrolled in the study. One participant was found to be negative for both DQ2 and DQ8 and upon further investigation this participant was concluded not to have coeliac disease and was excluded. In general, the study was well tolerated. Two of the 20 participants, both in the high gluten group, developed severe gastrointestinal symptoms requiring a reduction in gluten dose. All other participants consumed gluten per protocol. Four participants were unable to tolerate LAMA testing due to gastrointestinal symptoms. The sequential unsedated endoscopies were well tolerated and a single participant was unable to complete the third endoscopy due to discomfort. Two further participants missed their second endoscopy due to unexpected personal scheduling conflicts. Fifty-six of the 57 endoscopies resulted in pathology suitable for evaluation of mucosal morphology. The single endoscopy which did not produce evaluable samples was the second endoscopy in the subject who did not undergo a third endoscopy due to poor tolerance.
Demographics and clinical characteristics at study entry of the 20 included participants can be found in table 1. The low and high gluten groups were generally similar and the overall study population was similar to the overall local coeliac disease population with some exceptions. While the current age of the low and high gluten groups was similar, the age of coeliac diagnosis was younger in the low gluten group and as a consequence the length of time since coeliac diagnosis and the length of time on a gluten-free diet were longer in the low gluten group. Similarly, the length of time between symptom onset and coeliac diagnosis was shorter in the high gluten group, which may be related to more recent diagnosis.
Baseline demographic and clinical characteristics
Histology
On initial biopsy, the mean Vh:Cd was 2.21 (range 1.00–3.66) and the mean IEL count was 32.59 (range 8.75–60.00). Of the 17 participants with evaluable pathology on day 3 of gluten challenge, mean Vh:Cd decreased to 1.79 (range 0.33–4.00, p=0.126 compared with initial biopsy) and the mean IEL count was unchanged at 35.72 (range 7.50–65.70, p=0.30 compared with initial biopsy). In the 19 participants with a biopsy on day 14 of gluten challenge, the mean Vh:Cd decreased to 1.12 (range 0.00–3.67, p<0.001 compared with initial biopsy) and the mean IEL count increased to 51.81 (range 20.00–114.50, p<0.001 compared with initial biopsy) (figure 1A,B and table 2; see supplementary tables 1 and 2 for expanded data). In the 20 participants at baseline, seven were Marsh 0 (35%), three were Marsh 0-1 (15%), seven were Marsh 1 (35%) and three were Marsh 3 (15%). On day 14 of gluten challenge, in 19 evaluable participants, three (15.79%) participants were Marsh 0, three (15.79%) were Marsh 1 and 13 (68.42%) were Marsh 3 (of whom two, seven and four were Marsh 3a, 3b and 3c, respectively). No significant differences were seen in the degree of histological change between the high and low gluten groups (for Vh:Cd, p=0.670 or for IEL count, p=0.409, figure 1C,D). Similarly, when the cohort was divided into greater or less than the median 48 months on the gluten-free diet, no significant differences were seen in the degree of histological change between the two groups (supplemental figures 1 and 2).

Histological parameters at baseline and on day 3 and day 14 of gluten challenge. (A) Villous height to crypt depth ratio. (B) Intraepithelial lymphocyte count per 100 enteroctyes. (C) Villous height to crypt depth ratio in low and high gluten dose groups. (D) Intraepithelial lymphocyte count per 100 enteroctyes in low and high gluten dose groups.
Proportion of participants responding to gluten challenge
Serology
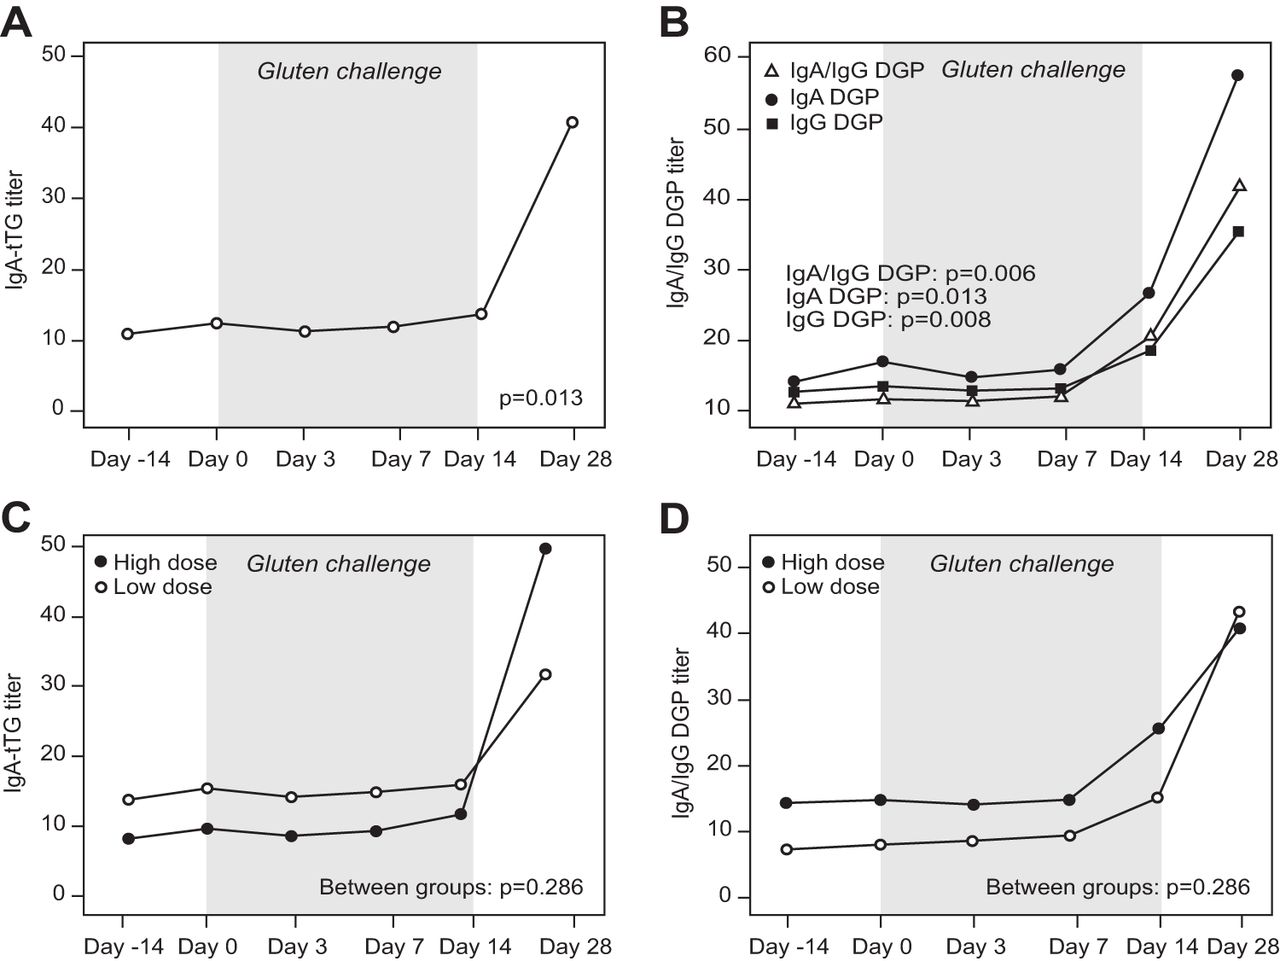
At baseline, the mean IgA anti-tTG was 11.02 (range 2.70–32.30) and the mean IgA/IgG anti-DGP was 10.93 (range 0.80–93.00). Titres were stable on days 0, 3 and 7 of gluten challenge for both IgA anti-tTG (mean 12.52, 11.39 and 12.05, respectively) and IgA/IgG anti-DGP (mean 11.61, 11.51 and 12.34, respectively). Mean antibody titres were increased on day 14 of gluten challenge (mean IgA anti-tTG 13.88, range 2.50–31.10, p=0.010 compared with baseline; mean IgA/IgG anti-DGP 21.17, range 2.70–91.00, p=0.036 compared with baseline). On day 28, 14 days after the end of the gluten challenge, the mean IgA anti-tTG had risen further to 40.78 (range 2.50–180.90, p=0.013 compared with baseline) and the mean IgA/IgG anti-DGP to 43.52 (range 4.00–170.00, p=0.006 compared with baseline). Kinetics of increase in DGP titre was similar for IgA/IgG anti-DGP and the separate IgA and IgG anti-DGP assays (figure 2A,B and table 2; see supplementary tables for expanded data). No significant differences were seen in the degree of serological change between the high and low gluten groups (p=0.286 for IgA anti-tTG and p=0.971 for IgA/IgG anti-DGP) (figure 2C,D). As was seen for histology, when the cohort was divided into greater or less than the median 48 months on the gluten-free diet, no significant differences were seen in the degree of serological change between the two groups (supplemental figures 3 and 4).

Mean antibody titres from baseline through day 28. (A) Immunoglobulin (Ig)A anti-tissue transglutaminase (tTG). (B) IgA anti-deamidated gliadin peptides (DGP), IgG anti-DGP and IgA/IgG anti-DGP. (C) IgA anti-tTG in low and high gluten dose groups. (D) IgA/IgG anti-DGP in low and high gluten dose groups.
Lactulose to mannitol ratio
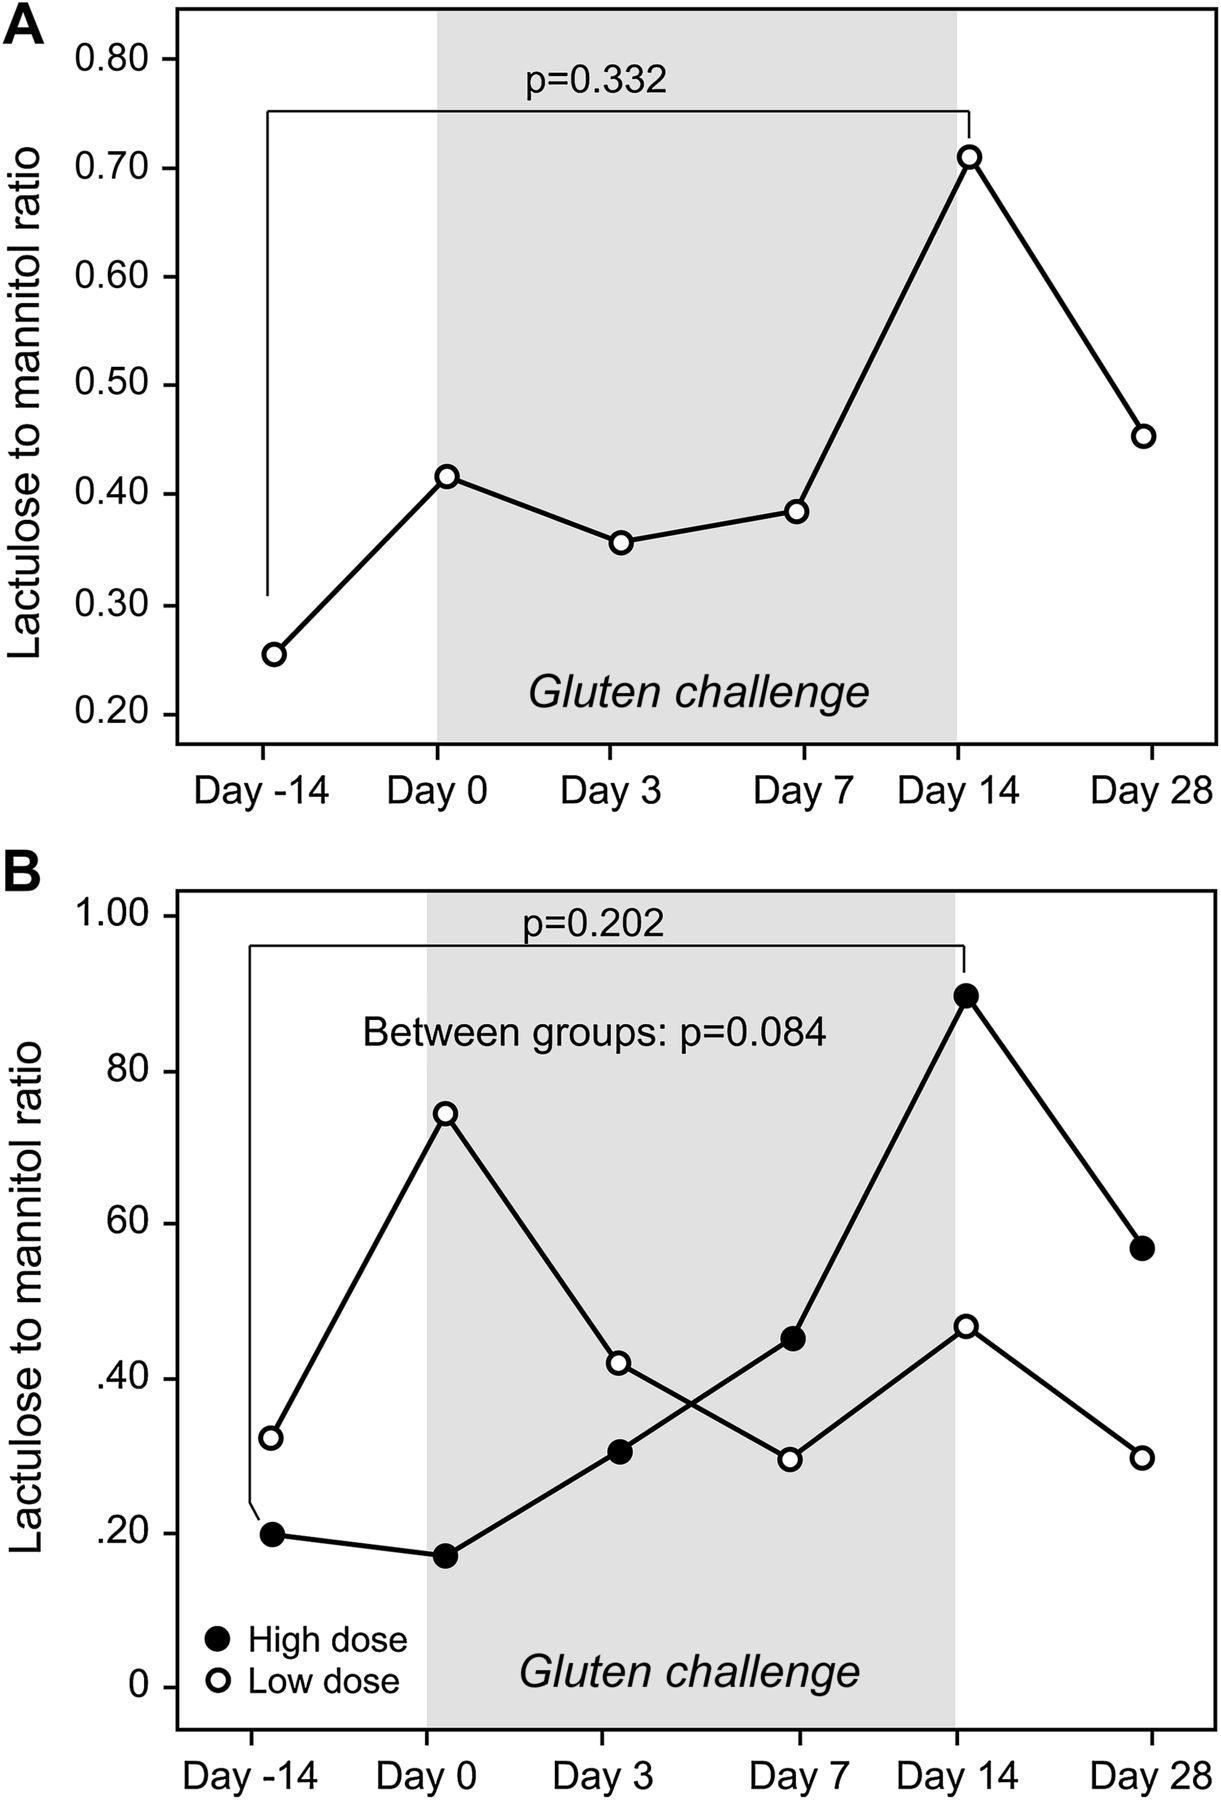
Mean baseline LAMA was 0.224 (range 0.0–0.73). LAMA was stable on days 0, 3 and 7 of gluten challenge (mean 0.378, 0.341 and 0.365, respectively). On day 14 of gluten challenge, the mean LAMA increased to 0.711 (range 0.050–4.00, p=0.332 compared with baseline) and decreased to 0.436 on day 28, 14 days postgluten challenge (p=0.208 compared with baseline and p=0.387 compared with day 14) (figure 3A). On separate evaluation of the sugars, mean mannitol concentration was 788.3 at visit 1 and decreased to 436.9 at visit 2 prior to gluten challenge and afterwards remained stable with levels of 484.9 at visits 3, 440.4 at visit 4, 493.9 at visit 5 and 541.8 at visit 6, p=0.205. Mean lactulose concentration was 151.9 at visit 1, 74.7 at visit 2 prior to gluten challenge and 128.0 at visit 3, 148.6 at visit 4, 237.6 at visit 5 and 162.9 at visit 6, p=0.151 (see supplementary tables for expanded data). No significant difference was seen in the degree of LAMA change between the high and low gluten groups (figure 3B).

(A,B) Mean lactulose to mannitol ratios from baseline through day 28. (A) From baseline through day 28. (B) Low and high gluten dose groups.
Symptoms
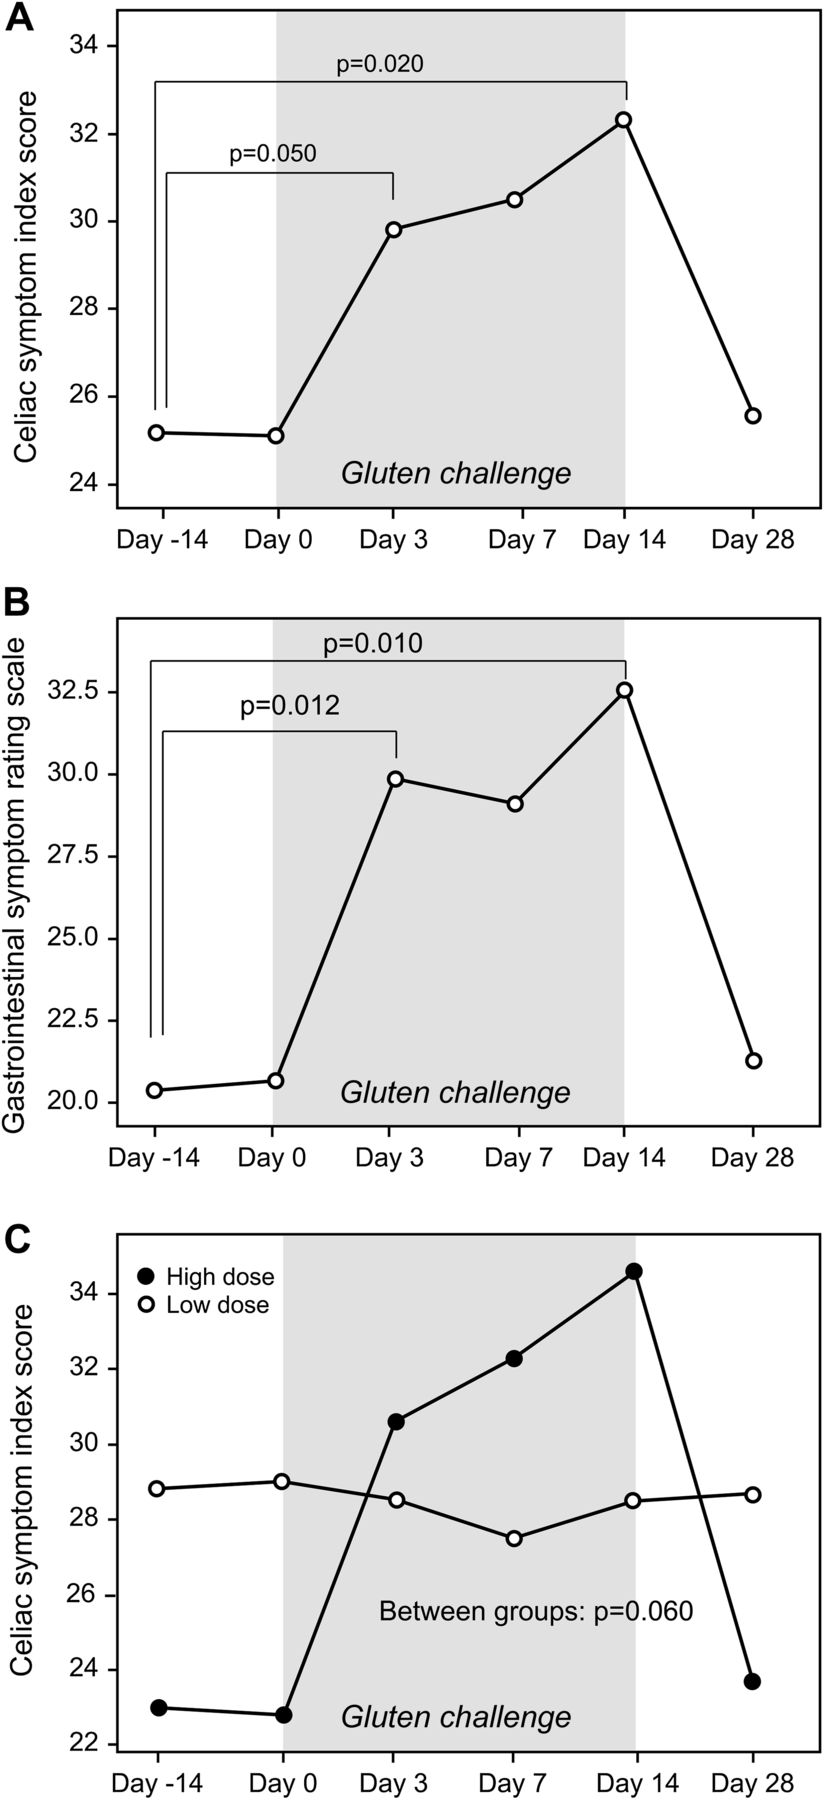
Gastrointestinal symptoms, as measured by both the CSI and GSRS increased significantly by day 3 of gluten challenge (p=0.05 and 0.01, respectively). They remained elevated and stable during gluten challenge from days 7 to 14 (baseline versus day 14, p values of 0.020 and 0.012 for the CSI and GSRS, respectively). Both CSI and GSRS scores returned to baseline 14 days after gluten challenge (figure 4A,B; see supplementary tables for expanded data). For both the CSI and GSRS, symptoms appeared greater in the high compared with the low gluten group, but this did not reach statistical significance (p=0.060 and 0.090, respectively) (figure 4C).

(A,B) Symptom Index Scores from baseline through day 28. (A) Celiac Symptom Index Scores. (B) Gastrointestinal Symptom Rating Scale Scores. (C) Celiac Symptom Index Scores in low and high gluten dose groups.
Correlation of non-invasive measures with intestinal histology
We sought to investigate which study end points correlated with the degree of intestinal damage and with change in histology from baseline. Low IEL count at baseline was correlated with greater absolute and per cent change in IEL count from baseline to day 14 (p=0.005 and p=0.003, respectively) but was not correlated with absolute or per cent change in Vh:Cd (p=0.711 and p=0.486, respectively). Vh:Cd at baseline was not correlated with either absolute or per cent change in Vh:Cd (p=0.297 and p=0.068, respectively) or with absolute or per cent change in IEL count from baseline (p=0.103 and p=0.319, respectively). IEL count at baseline was correlated with Vh:Cd at baseline (p=0.020) and day 14 (p=0.030) of gluten challenge; however, day 14 IEL count was not correlated with day 14 Vh:Cd (p=0.111). Baseline to day 14 change in Vh:Cd was not correlated with change in IEL count expressed either as an absolute difference (p=0.345) or as per cent change from baseline (p=0.554).
Change from baseline in IgA anti-tTG was highly correlated with change from baseline in IgA/IgG anti-DGP at both day 14 (p<0.001) and day 28 (p=0.005). There was no significant correlation between IgA anti-tTG or IgA/IgG anti-DGP titre and Vh:Cd or IEL count at any study visit. Similarly, there was no significant correlation between absolute change or per cent change from baseline in IgA anti-tTG or IgA/IgG anti-DGP titres and Vh:Cd or IEL count at day 14 or in change in Vh:Cd or IEL count from baseline.
Change in CSI score from baseline to day 14 (p=0.004) was correlated with day 14 IgA/IgG anti-DGP titre. There was no other significant correlation between symptoms or change in symptoms from baseline and Vh:CD, IEL count, IgA anti-tTG or IgA/IgG anti-DGP. There was no significant correlation between LAMA or change in LAMA from baseline with any other study measures at any time point.
Overall, of the 19 patients with evaluable pathology, four patients had no significant change in Vh:Cd by day 14 of gluten challenge. Of these four, one had a significant increase in IEL count and two began the study with highly abnormal Vh:Cd ratios of 1.3 and 1.0. By day 28, 15 of 20 individuals had abnormal anti-tTG or -DGP serological titres. Of the four patients without histological change, two had a significant increase in serology so that overall 17 of 19 (89.5%) of patients had findings consistent with coeliac disease after the 14-day gluten challenge.
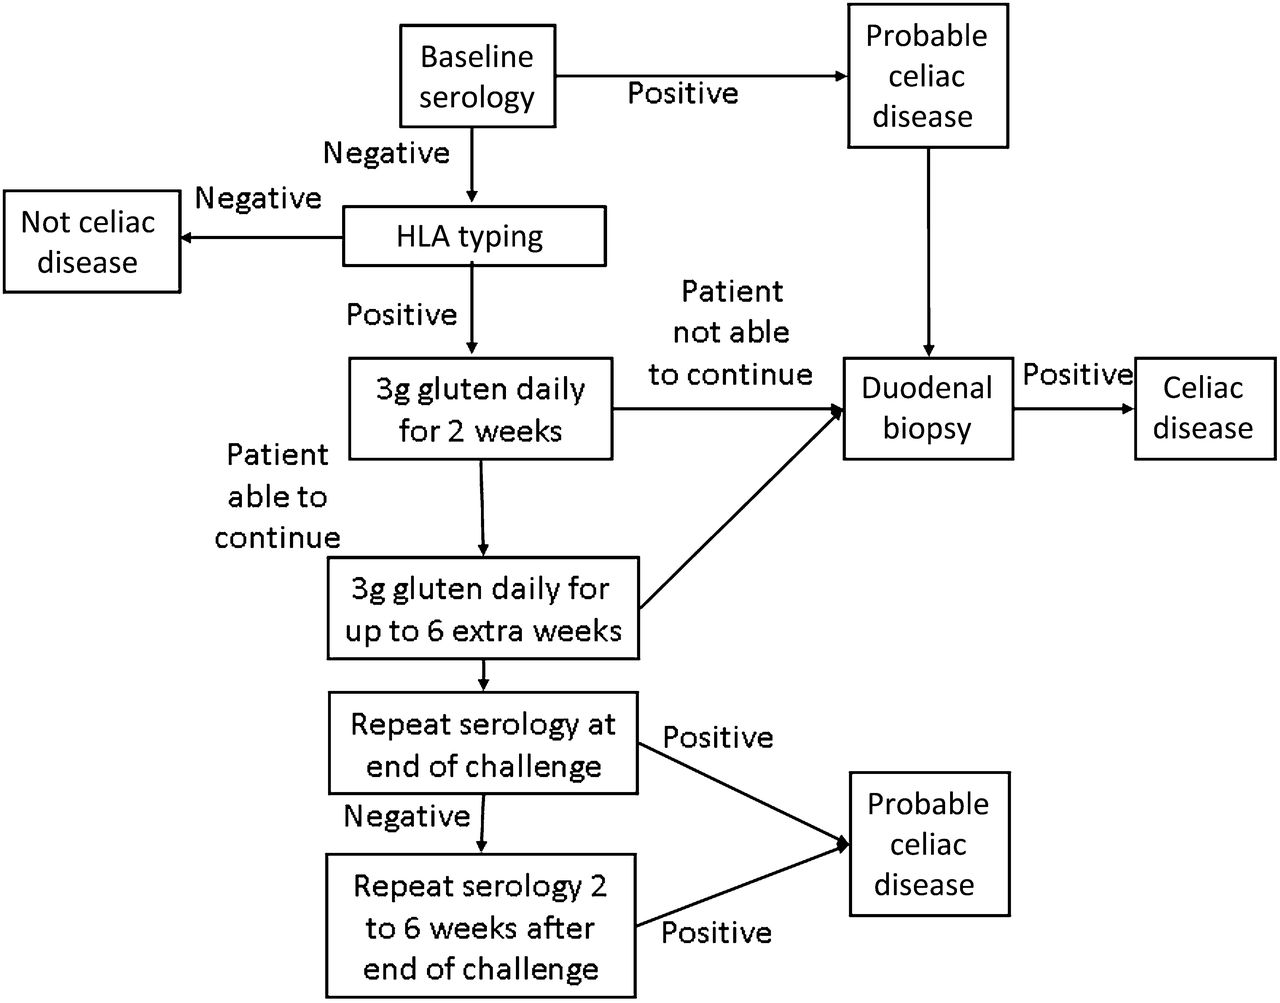
Based on the data presented, we propose several modifications to the current approach to performing a gluten challenge in clinical practice. Using evidence from this study we propose that a standard gluten challenge be conducted as follows: (1) perform baseline serology testing (IgA anti-tTG and/or IgA/IgG anti-DGP); if results are greater than twice the upper limit of normal for the specific assay in use, proceed directly to duodenal biopsy. Baseline duodenal biopsy in the setting of normal serological testing should be considered in patients known to be positive for HLA DQ2 or DQ8, and in whom gluten challenge is likely to be poorly tolerated necessitating possible abbreviation of challenge; (2) if serology is normal, test for HLA DQ2 or HLA DQ8 and if present, proceed with an initial 2-week gluten challenge at a gluten dose of 3 g per day (equivalent to ∼1½ slices of bread); (3) after a 2-week gluten challenge, approximately 90% of patients can be expected to develop findings consistent with coeliac disease; however, if the patient is tolerating gluten challenge well, consider extending the challenge for up to an additional 6 weeks in order to improve diagnostic sensitivity; (4) obtain duodenal biopsies at the termination of the challenge at week 2 (may prolong to 8 weeks if patient tolerating well); (5) perform repeat serology testing at the end of the challenge, that is, at the time of duodenal biopsy; (6) if biopsy histology and serology results are not diagnostic for coeliac disease repeat serology again 2 weeks after the end of the challenge; and (7) if biopsy and serological tests are all negative, coeliac disease is unlikely and the patient can continue on a regular diet with a final follow-up serological test 6–12 months later. As our findings show, the ability to offer a lower daily gluten load will reduce the acute symptoms of gluten challenge without reducing serological or histological responses. The option of terminating the challenge after just 2 weeks, in the event that symptoms are intolerable, will further enhance patient acceptance (figure 5).

Proposed modified gluten challenge algorithm.
Conclusion
Gluten responsiveness is a defining feature of coeliac disease and response to gluten challenge is a central feature of diagnostic algorithms and clinical trials. For these reasons, data on the kinetics of histological, serological and symptomatic responses to gluten challenge in adults with coeliac disease are vital for both patient care and clinical trial design. Given the lack of well-controlled studies on this topic, especially comparing and combining these parameters in a single study, our aim was to evaluate in a systematic fashion the histological, serological and symptomatic changes that occur in adults with coeliac disease undergoing a defined 14-day challenge with two different doses of gluten.
Utilising a protocol of repeat duodenal biopsies quantitatively and independently assessed by two blinded gastrointestinal pathologists, we found a significant decrease in Vh:Cd and increase in IEL count by day 14 of gluten challenge in the majority of participants. That this finding was independent of the gluten dose is novel and significant for a number of reasons. First, the significant deterioration in intestinal histology in most subjects suggests that trials of interventions to protect individuals from the effects of gluten exposure can be effectively conducted over 2 weeks with a relatively small number of participants. Second, currently, many patients on a gluten-free diet but without a clear diagnosis of coeliac disease are unwilling to undergo a standard gluten challenge due to the prospect of consuming a high gluten dose (typically 8–10 g, equivalent to ∼4 slices of bread, daily) for a prolonged period of time (typically 6–8 weeks) with the likelihood of experiencing significant symptoms. In this study, we demonstrate that 68% of patients had a Marsh 3 lesion by day 14 at both the 3 and 7.5 g gluten dose and 65% had IgA-tTG or IgA/IgG DGP titres above the upper limit of normal on day 28 (table 2). Additionally, while the serological and histological changes did not vary substantially between high and low dose gluten groups, the exacerbation of gastrointestinal symptoms was more severe in the high gluten group. Together, these findings indicate that the traditional gluten challenge may be reduced in duration and gluten quantity in the majority of individuals decreasing the burden of testing and increasing patient compliance.
An additional interesting finding was that while both IgA anti-tTG and IgA/IgG anti-DGP increased slightly but significantly from baseline to day 14 of gluten challenge, a much more dramatic increase was seen at day 28, 14 days after the end of the gluten challenge when gastrointestinal symptoms had returned to baseline. While this finding may have been anticipated based on humoural responses to infection and vaccination,31 to our knowledge the delayed elevation of serological titres in coeliac disease following gluten exposure has not been described. The delay between exposure and measurable anti-tTG and anti-DGP response helps to explain the poor correlation between gluten exposure and serological titres seen in multiple prior studies.32–35 Further, we note that while both anti-tTG and -DGP increased significantly between day 14 and day 28, the timing of the peak serological response is not known. Indeed, one participant who did not have a significant elevation in IgA anti-tTG on day 28 was found to have doubled her anti-tTG titre to twice the upper limit of normal in a routine clinic visit 58 days after the final study visit and 72 days after resuming her normal gluten-free diet. Despite the significant increases in serological titres and deterioration of histology seen in this study, the two outcomes were poorly correlated, even when comparing day 14 histology with day 28 serology which is consistent with prior studies evaluating response to therapy.28 ,33–37
Of the four major study end points, histology, serology, symptoms and LAMA, only LAMA had no significant change over the study period. While a slight increase in LAMA was noted, the high variability of both intraindividual and interindividual values precluded a clear signal. Even when limiting analysis to individuals with significant histological deterioration, LAMA change remained non-significant (p=0.401). Based on these data, LAMA with overnight urine collection is both relatively poorly tolerated and does not appear to be reliable in an outpatient setting. It is possible, however, that shorter times of urine collection may be less affected by intestinal motility and colonic absorption and thus be more specific for small intestinal changes.38 Additionally, given the high variability in LAMA measurements we estimate that at least 49 patients would have been necessary to include to rigorously assess LAMA as a primary outcome.
Conversely, clinical symptoms as measured by both the CSI and GSRS were reliable and responsive measures of gluten exposure. Change in symptoms scores was seen primarily in the high dose gluten group (figure 4C); however, this finding may be an artefact of the comparatively high level of baseline symptoms in the low gluten dose group. Both patient reported outcomes were stable on the two baseline visits and rose significantly by day 3 of gluten challenge, remained elevated throughout gluten exposure and returned to baseline by 14 days postgluten challenge. While this would suggest that symptoms are the most responsive measure of gluten exposure, change in symptom severity was not restricted to individuals with histological or serological changes. Explanations for this include that individuals with coeliac disease are sensitive to more subtle intestinal inflammation than can be reliably detected on biopsy or through serology or that there is a component of gluten sensitivity not dependant on adaptive immunity in individuals with coeliac disease. Additionally, there may also be a psychological component to symptom exacerbation as this study was not blinded; however, the fact that blinded studies of gluten exposure produce early symptoms as well suggest that this is unlikely to be a major explanation.39
Our study has a number of strengths including sequential histological evaluation by two independent, blinded gastrointestinal pathologists, randomisation to different gluten doses, compliance to diet and gluten challenge assessment by registered dieticians, and a well-defined population of patients with biopsy proven coeliac disease on a gluten-free diet for more than 12 months. There are however some limitations to the study which should be noted. First, although the use of sequential biopsies maximises power by allowing each individual to serve as his or her own control, the study was only moderate in size and drawn from a single centre. While the characteristics of the study population broadly matched our overall, much larger coeliac cohort (table 1), results should be confirmed in other populations. Additionally, while all participants met criteria for study entry, many had significant inflammation on duodenal biopsy at baseline which may have limited the effect of gluten challenge. Although individuals with less duodenal mucosal inflammation at baseline may be expected to have more significant changes in response to gluten challenge, a correlation was seen between IELs at baseline and change in IELs from baseline to day 14 but no correlation was found between Vh:Cd at baseline and change in Vh:Cd from baseline to day 14. It is also possible that separately either villous height or crypt depth may have performed kinetically differently or correlated with LAMA. Further, we know from multiple studies that complete mucosal healing in adults with coeliac disease is uncommon,7 ,8 ,34 ,40 ,41 and thus restricting our study to a cohort with normal duodenal mucosa at baseline may not be practical or representative of the overall population. Finally, we note that the high and low gluten groups were significantly different in a few factors including time since diagnosis, time on a gluten-free diet and GSRS score. However, as major study outcomes did not vary between high and low dose gluten or with degree of initial intestinal damage, the effect of failure of randomisation to balance all clinical variables appears minimal.
In summary, we have shown that significant histological, serological and symptomatic changes occur in adults with coeliac disease undergoing gluten challenge at a dose of 3 g of gluten or higher. It is also notable that change in intestinal histology was not correlated with serology, symptoms or LAMA levels. Anti-tTG and anti-DGP titres did not rise appreciably until 14 days after gluten challenge but continued to rise after the gluten challenge ended consistent with the kinetics of humoural immune responses to infection and immunisation. If we accept that duodenal mucosal damage is the gold standard marker of coeliac disease activity, then it is clear that, despite out encouraging findings, improved non-invasive markers of coeliac disease activity are greatly needed for use in patient management and clinical research. Finally, it is clear that sensitivity to gluten exposure varies greatly between individuals with coeliac disease and a minority of individuals had no significant clinical, serological or histological deterioration after 14 days of significant gluten exposure. This fact suggests that the necessary strictness of the gluten-free diet to prevent coeliac disease activity may not be equal for all individuals with the disease, at least in short term. An accurate, non-invasive measure of coeliac disease activity would be valuable in many respects and may allow the strictness of the gluten-free diet to be personalised without negative consequences. Overall, the data on the kinetics of histological, serological and symptomatic responses to gluten challenge provided by this study should have significant relevance in the care of individuals with suspected coeliac disease considering gluten challenge, and in the design and evaluation of coeliac clinical trials.
References
Supplementary materials
Supplementary Data
This web only file has been produced by the BMJ Publishing Group from an electronic file supplied by the author(s) and has not been edited for content.
Files in this Data Supplement:
- Data supplement 1 - Online tables
Footnotes
-
Funding The project described was supported by Grant Number UL1 RR025758-Harvard Clinical and Translational Science Center, from the National Institute of Health, National Center for Research Resources and by National Institute of Health, National Institute of Diabetes and Digestive and Kidney Diseases grant K23 DK082619. The content is solely the responsibility of the authors and does not necessarily represent the official views of the National Center for Research Resources or the National Institutes of Health. NIH DK1042103881.
-
Competing interests None.
-
Ethics approval Ethics approval was provided by BIDMC Committee on Clinical Investigations.
-
Provenance and peer review Not commissioned; externally peer reviewed.
-
Data sharing statement All data are available upon request.