Article Text

Abstract
Background Many health systems across the globe have introduced arrangements to deny payment for patients readmitted to hospital as an emergency. The purpose of this study was to develop an exploratory categorisation based on likely causes of readmission, and then to assess the prevalence of these different types.
Methods Retrospective analysis of 82 million routinely collected National Health Service hospital records in England (2004–2010) was undertaken using anonymised linkage of records at person-level. Numbers of 30-day readmissions were calculated. Exploratory categorisation of readmissions was applied using simple rules relating to International Classification of Diseases (ICD) diagnostic codes for both admission and readmission.
Results There were 5 804 472 emergency 30-day readmissions over a 6-year period, equivalent to 7.0% of hospital discharges. Readmissions were grouped into hierarchically exclusive categories: potentially preventable readmission (1 739 519 (30.0% of readmissions)); anticipated but unpredictable readmission (patients with chronic disease or likely to need long-term care; 1 141 987 (19.7%)); preference-related readmission (53 718 (0.9%)); artefact of data collection (16 062 (0.3%)); readmission as a result of accident, coincidence or related to a different body system (1 101 818 (19.0%)); broadly related readmission (readmission related to the same body system (1 751 368 (30.2%)).
Conclusions In this exploratory categorisation, a large minority of emergency readmissions (eg, those that are potentially preventable or due to data artefacts) fell into groups potentially amenable to immediate reduction. For other categories, a hospital's ability to reduce emergency readmission is less clear. Reduction strategies and payment incentives must be carefully tailored to achieve stated aims.
This is an Open Access article distributed in accordance with the Creative Commons Attribution Non Commercial (CC BY-NC 3.0) license, which permits others to distribute, remix, adapt, build upon this work non-commercially, and license their derivative works on different terms, provided the original work is properly cited and the use is non-commercial. See: http://creativecommons.org/licenses/by-nc/3.0/
Statistics from Altmetric.com
Key messages
What is already known on this subject?
Research has shown that the concept and measurement of emergency readmissions is complex in nature. Readmissions are not necessarily the result of poor quality care in hospital. However, policies are in place across the globe to refuse payment for services related to patients readmitted to the hospital within 30 days.
What this study adds?
Six exclusive causes of potentially preventable readmissions were defined by the investigators and consultants in related fields. Readmissions between 2004 and 2010 were assigned to one of the categories. The authors conclude that this type of framework can be used to determine which readmissions should have payment withheld.
Background
Emergency admissions and readmissions are rising in England and in many other countries.1–3 In response to this trend, healthcare organisations such as the Department of Health (DH) in England and Medicare and Medicaid in the USA have produced guidance on restricting payments for readmission within 30 days of discharge from a previous (index) admission.4 ,5
The concept of readmission as a measure of adverse outcome is beguiling, but previous research suggests its can be a complex area.6 Emergency readmissions are not necessarily the result of poor quality of hospital care7 nor are they due to reducing length of stay.8 A recent meta-analysis demonstrated that fewer than one in four readmissions were deemed avoidable.9 Little is known about the systematic causes of readmission, and caution needs to be exercised when interpreting readmission statistics.9 Until now, research has mainly been concerned with identification of risk factors (often demographic aspects) predictive of readmissions and identification of the most common types of primary diagnosis in readmissions.10–12
The policy rationale for non-payment is based in the idea that readmissions result from suboptimal care and are preventable. However, other reasons for readmission are recognised. Readmission may be an inevitable consequence of some longer-term disease processes and for some patients frequent emergency admissions may constitute an anticipated plan of care.13 Patient preferences may also influence readmission—for example, when patients self-discharge or seek to avoid hospital stays over major public holidays. There is also the chance that readmissions are coincidental and linked with an external event or accident—the proverbial ‘being run over by a bus’.
Interventions aimed at preventing readmissions have been well documented,14 but their effectiveness in different situations is likely to depend on the underlying cause of readmission, and identifying which readmissions are preventable is challenging.15 ,16 A review of evidence by Van Walraven and colleagues17 found the proportion of readmissions deemed avoidable varied considerably among 34 studies (median 27%, range 5–79%). There have been a number of frameworks to classify readmissions, although often with different intentions. For example, Halfon et al11 structured a framework around clinical risk factors in preventable readmissions, Graham and Livesley18 focused on suboptimal care and patient misadventure, while Goldfield et al19 used a complex matrix of diagnostic code pairs.
To expand and develop on previous research, we investigated emergency readmissions to hospital within 30 days in England over 6 years. Our purpose was to develop a preliminary categorisation of readmission using routine National Health Service (NHS) hospital data that would group cases with similar causal patterns to help providers and funders of care to understand better how to reduce such events. We based the categorisation on diagnostic codes and admission–readmission patterns.
Our aim was to create a general classification process that would allow large numbers of readmissions to be assigned at the organisational level to credible, hierarchically exclusive categories while being simple enough to be implementable in practice.
Methods
Drawing on previous literature, we hypothesised six main causes of readmission (box 1) and developed operational definitions for each group. Six senior consultant specialist advisors from five specialties (trauma and orthopaedics, care of the elderly, renal medicine, clinical pharmacology and emergency medicine) advised on the categories and descriptive wordings.
Categories of readmission
Potentially preventable—Combinations of diagnosis and admission codes were used to indicate where altered care in a prior admission might potentially have prevented readmission
Category A1: Probable suboptimal care: primary readmission diagnosis of ‘complications of surgical & medical care not elsewhere classified’
Category A2: Possible suboptimal care: readmission diagnosis of common avoidable complications; diagnoses of ‘symptoms and signs’ in the index admission and returned with a more specific diagnosis; patient with one recorded emergency readmission for the same condition within 30 days (excluding cancer and chronic conditions) in the 6-year study period; emergency readmission on the day of discharge
Anticipated but unpredictable hospital care—For some patients, frequent emergency admissions are common as part of an anticipated plan or pattern of care. Sometimes these will occur within 30 days of a previous discharge. Definitions for categories B1 and B2 drew on a previous categorisation13 and included readmission patterns for two or more admissions in 2 or more years, excluding those in category A (above)
Category B1: Ill but stable: individuals with two or more readmissions in 2 separate years but with relatively little variability over time
Category B2: Unstable deterioration: individuals with more than 10 readmissions in a single year or high variability over time
Category B3: Non-medical risk factors: individuals where substantial factors in their readmission may be beyond the control of the health service because of potential health hazards related to their socioeconomic and psychosocial circumstances or behavioural issues (eg, alcohol misuse)
Preference—This category covers both patient and staff preferences. It includes self-discharge and identifiable patterns of discharge and readmission around public holidays
Artefact—Readmissions in this category are likely to be planned/elective but have been mistakenly coded as an emergency readmission. This includes primary readmission diagnosis of ‘follow-up’ and excess readmissions observed on the 7th, 14th, 21st and 28th days after discharge
Accident or coincidence related to different body system—These readmissions were defined as emergency 30-day readmissions in a different ICD-10 chapter from the index admission. For these readmissions, coding does not indicate a common factor between index admission and readmission
Broadly related (related to same body system)—This residual category contains readmissions that are broadly related to the previous admission where index and readmission diagnoses match within ICD-10 chapter
The logic of the grouping was first to identify cases where altered care in a prior admission might potentially have prevented readmission. For the next category, we aimed to identify patterns of admission and discharge common in chronic disease or likely to be associated with a need for long-term care. For the third category, we grouped 30-day readmissions according to whether we could detect effects of patient preferences, artefacts or errors in recording. The last two groups represent patients where the readmission diagnosis appeared either to be unlinked to the admission diagnosis or to be linked—that is, they fell into either different International Classification of Diseases (ICD) chapter headings (disease system headings) or the same ICD chapter headings but where no other clear rationale for readmission could be detected.
The readmissions categories were defined sequentially by applying a limited set of rules to the ICD-10 diagnostic codes in the index admission–readmission pair and to patterns of readmission over time. Full details of codes used are in online appendix 1. We assigned readmissions to the categories exclusively and hierarchically (e.g., a readmission eligible for both category A and category B would be placed in category A). Numbers and percentages in each category were calculated.
Data sources
We used anonymised person-level hospital episode statistics (HES) data20 for six financial years from April 2004 to May 2010, covering all inpatient admissions in the NHS in England allowing us to link hospital inpatient spells for the same individual over time. These datasets are used as the basis for funding hospital services in England and in basic service planning and form the basis for calculations of readmission in the NHS. Fields used were individual identifier, admission and discharge date, listed primary and other diagnoses, and case type as captured by Healthcare Resource Group (HRG). Some episodes (mental health diagnoses and uncoded episodes HRG chapters T and U) were excluded on the basis of their HRG codes. The HES data are made up of finished consultant episodes (FCEs) (i.e., periods under the care of a particular consultant), and an inpatient spell may contain several FCEs.
Analysis
Data were analysed using a combination of standard SQL queries and Statistical Analysis Software V.9.3.21 CIs were calculated for the ratio of observed to expected admissions using an approximation to a Poisson distribution.22
Detecting emergency readmissions within 30 days
The FCE data were converted into two subsets: every episode where the FCE was the last in the hospital spell and the patient was discharged alive between April 2004 and March 2010 (the ‘index’ admissions); and every episode where the FCE was the first in a hospital spell and the patient was admitted between April 2004 and May 2010 (potential readmissions). We included April and May 2010 in the analysis to ensure that all relevant (30-day) readmissions for the preceding financial year were captured.
These two groups were then linked on an individual identifier. Admissions occurring within 30 days of the discharge date for an index admission were extracted as the readmissions dataset. If a patient had multiple discharges within a 30-day period, the discharge immediately preceding the readmission was treated as the index admission (i.e., we avoided double counting chains of readmissions). Readmissions for an individual are identified irrespective of hospital provider. We selected readmissions within 30 days, as this is the time limit set out in the non-payment policy. Other authors have explored the effect of adjusting this time constraint.23
Estimating excess readmissions
Although the majority of our analyses were based on examining individual admission–readmission pairs, two sub-categories (C2 and D2) and some supporting analysis involved comparing the observed number of readmissions with an expected number. In category C2 and the supporting analysis, the expected number was calculated using indirect standardisation. That is, the expected values were calculated by applying the national average readmission rates specific to each age group, sex, admission method of index admission and HRG. Category C2 also included day of the week. In category D2, the expected number was based on interpolation between the days either side of the day in question.
Applying the non-payment policy
We used DH guidance to estimate the proportion of readmissions liable to withholding of payment in each category.4 The 2011/2012 NHS scheme advocated withholding payment for a subset of readmissions that meet the following conditions: readmissions within 30 days of an elective index admission; where the patient is 4 or more years old and not being treated for cancer or maternity. In addition there were instructions to agree a ‘no payment’ threshold on readmissions locally aimed at a minimum 25% reduction against the previous year's readmission rate.
Results
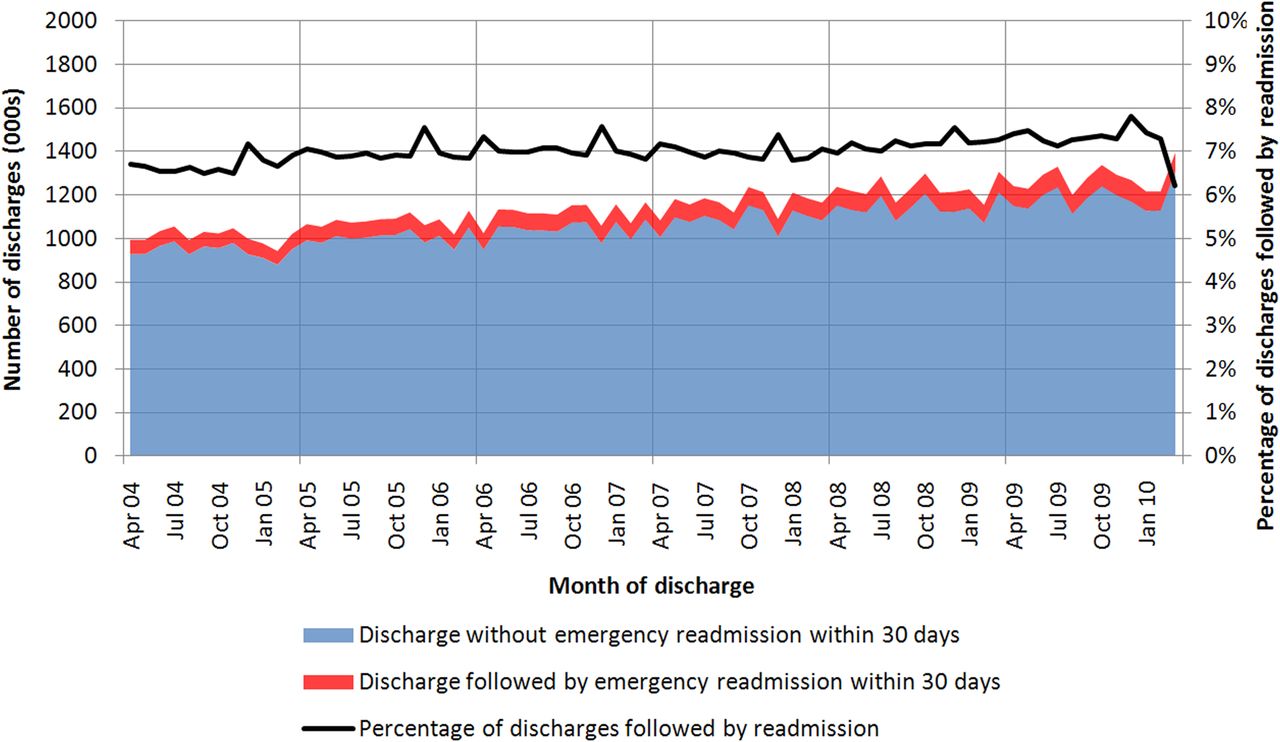
There were 82 488 968 relevant live discharges from hospital experienced by 28 165 626 individuals in England over the period 1 April 2004 to 31 March 2010. There were 5 804 472 emergency readmissions experienced by 3 349 104 individuals within 30 days, equating to an overall 30-day emergency readmission rate of 7.0% and a range of 6.1–7.8% (figure 1). Fluctuations reflect high levels of admissions in winter. There was a small gradual increase in readmissions over the study period with an average increase of 0.01% per month. Box 2 gives some illustrative examples of readmission cases and how they were categorised.

Monthly emergency readmission rates for England 2004/05 to 2009/10. (The dip in readmission rates in the last month of the study period (March 2010) is likely to be an artefact due to an end of year increase in discharges.)
Anonymised examples of the classification system based on hospital episode statistics (HES) data
A1: Potentially preventable—probable suboptimal care: A patient between the ages of 40 and 50, initially admitted for elective surgery for a malignant neoplasm of upper-outer quadrant of breast. Also noted were diagnoses of secondary malignant neoplasm of lymph nodes and family history of malignant neoplasm. The patient was discharged after 2 days in hospital, but 10 days later was readmitted as an emergency via the general practitioner, with haemorrhage and haematoma complicating a procedure.
A2: Potentially preventable—possible suboptimal care: A patient between the ages of 20 and 30, initially admitted to gynaecology as an ordinary elective admission for medical abortion, recorded as complete without complication. No other diagnoses were recorded. The patient was discharged with clinical consent after 5 days in hospital. Three days later she was readmitted as an emergency with incomplete medical abortion complicated by delayed or excessive haemorrhage. In the 3 years before this emergency readmission, the patient had one elective admission and no emergency admissions.
B1: Anticipated but unpredictable hospital care—ill but stable: A patient within the ages of 50–60, initially admitted to nephrology as an emergency with end-stage renal disease. Also noted were diagnoses of bilateral small kidney, failure and rejection of transplanted organs and tissue, renal tubulointerstitial disorders in transplant rejection, and urinary tract infection. The patient was discharged after 16 days in hospital. Three weeks and 3 days later the patient was readmitted as an emergency with non-infective disorders of lymphatic vessels and lymph nodes. Also noted were diagnoses of transplanted organ and tissue status, sleep disorders and cytomegaloviral disease. In the 3 years before this emergency readmission, the patient had four elective admissions and two emergency admissions (none of these were emergency readmissions within 30 days). The patient has a broadly constant number of admissions year on year within the study period.
B2: Anticipated but unpredictable hospital care—unstable deterioration: A patient within the ages of 50–60, initially admitted to rheumatology as an emergency via A&E with rheumatoid arthritis. Also noted were diagnoses of syncope and collapse, essential (primary) hypertension, and personal history of allergy to penicillin. The patient was discharged after 31 days in hospital. Ten days later the patient was readmitted to rheumatology as an emergency via Bed Bureau with rheumatoid arthritis. No other diagnoses were recorded. In the 3 years before this emergency readmission, the patient had two elective admissions and eight emergency admissions (five of which were emergency readmissions within 30 days). The patient has a highly variable number of admissions year on year within the study period.
B3: Anticipated but unpredictable hospital care—non-medical risk factors: A patient within the ages of 40–50, initially admitted as an emergency via A&E with superficial injury of scalp. Also noted were diagnoses of assault by sharp object, essential (primary) hypertension, epilepsy and alcohol use. The patient was discharged after 1 day in hospital. Two weeks and 3 days later the patient was readmitted to clinical pharmacology as an emergency via A&E with respiratory tuberculosis, without mention of bacteriological or histological confirmation. Also noted were diagnoses of mental and behavioural disorders due to withdrawal state from use of alcohol, depressive episode, epilepsy and drug use. In the 3 years before this emergency readmission, the patient had no elective admissions and nine emergency admissions (one of which was an emergency readmission within 30 days).
E: Accident or coincidence—related to a different body system: A patient within the ages of 70–80 initially admitted to general surgery as an emergency via A&E with urinary tract infection. Also noted were diagnoses of hyperplasia of prostate and retention of urine. The patient was discharged after two days in hospital. Two weeks and 6 days later, he was readmitted to general medicine as an emergency via A&E with atrial fibrillation and flutter. Also noted were diagnoses of atrioventricular and left bundle-branch block, essential (primary) hypertension, chronic ischaemic heart disease, non-insulin-dependent diabetes mellitus, and personal history of diseases of the circulatory system. In the 3 years before this emergency readmission, the patient had one elective admission and two emergency admissions (none of which were emergency readmissions within 30 days).
F: Broadly related—related to the same body system: A patient within the ages of 60–70 initially admitted to general medicine as an emergency via A&E with chest pain. Also noted were diagnoses of non-insulin-dependent diabetes mellitus, cardiomegaly, hypothyroidism and personal history of diseases of the circulatory system. The patient was discharged after 11 days in hospital. Eight days later the patient was readmitted to general medicine as an emergency via A&E with dizziness and giddiness of cardiovascular origin. The same additional diagnoses were noted. In the 3 years before this emergency readmission, the patient had one elective admission and two emergency admissions (none of which were emergency readmissions within 30 days).
The following section outlines the numbers of cases in each category.
Category A: potentially preventable—probable or possible suboptimal care during index admission
Only 5.39% (312 891) of emergency readmissions (an average of 52 149 readmissions per year) were caused by a recognised complication of an index admission. A further 24.6% (1 426 628in 6 years: and 237 771 per year) were classified into the less specific ‘possible suboptimal care’.
Category B: anticipated but unpredictable hospital care
Overall, 19.7% of readmissions fell into this group, characterised by a pattern of multiple admissions over a longer time period.
We found that 7.6% of readmissions fulfilled criteria for category B1 (ill but stable) and 5.4% for category B2 (unstable deterioration), which represented a substantial number of readmissions but related to a relatively small number of individuals. There was also a significant subset of cases (391 385 readmissions, 6.7%) with codes indicating ‘non-medical risk factors’ including alcohol, problematic drug use, etc.
Category C: preference
After excluding readmissions classified as category A or B above, we found 53 718 (0.93%) readmissions following self-discharge, or discharge by a relative or advocate (category C1). In addition, we noted high levels of readmission associated with discharge dates before a public holiday or on a weekend—for example, the observed rate of readmission after a weekend was 3.2% higher than expected (p<0.001), equating to just under 4000 readmissions per year. They account for an additional 11 684 emergency readmissions, equivalent to 0.20% of all 30-day readmissions.
Category D: artefact
This category captured events that appear to reflect routine care rather than emergency readmissions and seem most likely to result from errors in recording. There were 16 062 readmissions where the second episode had a code indicating a routine follow-up, or where the individual had an unfeasibly high number of readmissions, or where multiple readmissions appeared at fixed time intervals after the original spell. Figure 2 shows one example of a readmissions pattern with clear spikes at 7, 14, 21 and 28 days after discharge. Such patterns varied by diagnosis. There was no pattern for acute myocardial infarction (red), while iron deficiency anaemia (green) showed a clear periodicity (figure 2). We estimated this artefactual periodicity to account for 47 787 additional readmissions.

Proportion of emergency readmissions within 30 days as a function of number days between discharge and readmission.
Category E: accident or coincidence—related to a different body system
In total, there were 1 101 818 emergency 30-day readmissions which fell into this category (19.0%). Only a very small proportion of these readmissions indicated mishaps involving buses (transport accidents made up 2812 (0.03%)).
Category F: broadly related—related to the same body system
There were just under two million (1 751 368) readmissions in this category, representing 30% of all emergency 30-day readmissions.
Categorisation and the non-payment policy
Figure 3 summarises the numbers and percentages of readmissions assigned to each category, and table 1 gives estimates of the percentage of readmissions in each category subject to mandatory non-payment based on English NHS guidelines.24 Overall, 17% of emergency readmissions within 30 days would be included in the ‘no payment’ scheme, but there was substantial variation between categories. The most penalised category was A1 (potentially preventable—probable suboptimal care, 49% non-payment), and the least penalised was B2 (unstable deterioration, 9%).

Process of assigning readmissions by descending category (columns) and the final proportions (pie chart), using the average annual number of readmissions.
Distribution of readmissions across categories, and proportion subject to non-payment guidance
Discussion
In this study we investigated emergency readmissions to hospital in England over 6 years using routine NHS hospital data from 2004 to 2010. Our aim was to develop a preliminary categorisation of emergency readmission within 30 days that might help to identify the scope for reduction in readmission rates. We identified 5.8 million (7.0%) emergency readmissions within 30 days of a previous (index) discharge and applied a preliminary categorisation of six exclusive hierarchical categories. We allocated the emergency readmissions into these categories using simple rules related to ICD diagnostic codes for both admission and readmission and numbers and patterns of recent admissions. We were deliberately cautious in our terminology—particularly with regard to preventability—as this is a much debated area in the literature.24 ,25
With this framework, no more than 30% of readmissions fell into the ‘potentially preventable’ category. In contrast, we estimated that 19% of readmissions were related to accident, coincidence or a disease in a different body system, with the implication that these are largely unavoidable. A very small fraction of readmissions appeared to be due to preference or artefact. The remaining readmissions were classed into groups where readmission may be part of the approach to longer-term care needs (25%).
Our categories suggest that the 2011/12 English payment system would have appropriately focused non-payment for readmissions on many cases, which it aimed to reduce, but that the system is likely to be subject to both false positives and false negatives. The latest guidance from the DH notes that the 2011/2012 policy of non-payment for emergency readmissions has been ‘complex to administer’ and replaces the rule-based system with clinical review for 2012/2013.8 These reviews will investigate a sample of readmissions and agree a percentage of all payments for readmissions to be withheld. We consider that the systematic framework presented here could be used to inform these reviews.
Strengths and limitations
The strengths of this study are that it used consistent definitions on a large number of cases in a comprehensive dataset for all NHS hospital discharges in England for a period of 6 years. Our dataset excluded data from non-NHS hospitals, which represent a small portion of all hospital activity in the UK. In addition, there are likely to be data quality issues in the routine HES dataset, in particular in relation to diagnosis coding, which may be inconsistent and not provide full details on likely causes of readmission. Inaccuracy in diagnostic coding would be expected to increase the proportion of cases in category E. Nevertheless, these are the data that are currently being used in the NHS to make decisions on whether readmissions are eligible for payment or not.
The study does not include detailed discussion of changing demography or morbidity levels in the underlying populations. The classification of ‘probable suboptimal care’ depends heavily on diagnostic codes indicative of definite medical or surgical complications, which could easily be substituted for less ‘accusatory’ generic diagnoses. We note that, if these diagnoses were to become a common reason for denying payment for readmission, this would be likely to discourage hospitals from applying them.
This work does not intend to propose any definitive framework for classifying readmission. Rather, an exploratory framework, based on existing literature and a limited survey of clinical opinion, was used to demonstrate a novel approach to estimating the prevalence of various likely causes of readmission. Further testing and refinement of this framework—for example, using case note review—is encouraged.
Implications for policy practice and research
This analysis is retrospective and was undertaken before the introduction of the system to deny payment for certain types of 30-day readmissions. The system may of course already have introduced the potential for organisations to ‘game’ their hospital coding to reduce the proportions of readmissions ineligible for payment, and this will be an interesting issue to explore in future analysis.
Whatever the exact details of the framework used, it is clear that that there are different types of emergency readmission, and payment methods should, where possible, be tailored to the different types. For many patients with chronic conditions, the majority of care may be carried out near to home—yet occasional intermittent hospital care (anticipated but unpredictable need for hospital readmission) is likely to be considered necessary or even a marker of good practice. In these cases, a balanced approach to place of care may be an indicator of good quality of care, rather than the converse.26
There are a number of reviews of the effectiveness of general interventions to reduce readmissions within 30 days.14 The actions that hospitals can take to reduce readmissions with respect to the categories include:
Investigate all category A readmissions (complications in the index admission) and ensure that quality assurance processes are in place to investigate adverse events
To reduce category B, investigate (a) all patients with an accelerating pattern of admission to hospital ensuring that appropriate care is in place and (b) consider higher-intensity care for patients with ‘non-medical risk factors’—it should be noted that this category includes cases where substantial factors may be beyond the control of the health services
For patients with deteriorating chronic conditions (category B2), payment plans may not be appropriately targeted at incentives to reduce hospital readmission in isolation, but instead should perhaps introduce incentives for care that spans primary and secondary modalities and other sectors
To reduce category C2, investigate discharge patterns and pathways related to weekends and bank holidays
To reduce category D, improve accuracy of coding and reporting of elective versus emergency episodes and check coding of patients with very large numbers of readmissions
To reduce categories B and F, interventions could be targeted using established predictive risk models.27
In conclusion, this analysis strongly suggests that it is possible to categorise emergency 30-day readmissions in England using routine hospital data and that this categorisation indicates some scope for reduction. In addition, we consider that, however challenging it is to reach consensus on the definitions used to categorise readmissions, reduction strategies and payment incentives should include awareness of the variations in reasons for readmission if they are to achieve their stated aims.
References
Supplementary materials
Supplementary Data
This web only file has been produced by the BMJ Publishing Group from an electronic file supplied by the author(s) and has not been edited for content.
Files in this Data Supplement:
- Data supplement 1 - Online supplement
Footnotes
Contributors IB, MB and AC were involved in the study design, the collection, analysis and interpretation of data, and the writing of the article. All authors revised the article in response to comments from reviewers and agreed the final text. AC will act as guarantor for the work. The guarantor accepts full responsibility for the conduct of the study, had access to the data, and controlled the decision to publish.
Competing interests None.
Provenance and peer review Not commissioned; externally peer reviewed.