Article Text

Abstract
Background In England the demand for emergency care is increasing, while there is also a staffing shortage. This has implications for quality of care and patient safety. One solution may be to concentrate resources on fewer sites by closing or downgrading emergency departments (EDs). Our aim was to quantify the impact of such reorganisation on population mortality.
Methods We undertook a controlled interrupted time series analysis to detect the impact of closing or downgrading five EDs, which occurred due to concerns regarding sustainability. We obtained mortality data from 2007 to 2014 using national databases. To establish ED resident catchment populations, estimated journey times by road were supplied by the Department for Transport. Other major changes in the emergency and urgent care system were determined by analysis of annual NHS Trust reports in each geographical area studied. Our main outcome measures were mortality and case fatality for a set of 16 serious emergency conditions.
Results For residents in the areas affected by closure, journey time to the nearest ED increased (median change 9 min, range 0–25 min). We found no statistically reliable evidence of a change in overall mortality following reorganisation of ED care in any of the five areas or overall (+2.5% more deaths per month on average; 95% CI −5.2% to +10.2%; p=0.52). There was some evidence to suggest that, on average across the five areas, there was a small increase in case fatality, an indicator of the ‘risk of death’ (+2.3%, 95% CI +0.9% to+3.6%; p<0.001), but this may have arisen due to changes in hospital admissions.
Conclusions We found no evidence that reorganisation of emergency care was associated with a change in population mortality in the five areas studied. Further research should establish the economic consequences and impact on patient experience and neighbouring hospitals.
- death/mortality
- emergency care systems
- emergency departments
This is an open access article distributed in accordance with the Creative Commons Attribution Non Commercial (CC BY-NC 4.0) license, which permits others to distribute, remix, adapt, build upon this work non-commercially, and license their derivative works on different terms, provided the original work is properly cited, appropriate credit is given, any changes made indicated, and the use is non-commercial. See: http://creativecommons.org/licenses/by-nc/4.0/.
Statistics from Altmetric.com
What this paper adds
What is already known on this topic
A small number of EDs in England have been closed due to issues around safety and sustainability, with further ED closures expected in other areas.
The impact of closure or downgrade of an ED in England on population mortality was unknown.
Existing evidence indicated that longer journey times to ED and the delayed onset of emergency treatments are detrimental to patient mortality.
What this study adds
We found no statistically reliable, consistent evidence of an increase in deaths among the population from serious emergency conditions in the period following the reorganisation of emergency care in the five geographical areas studied.
It may be possible to close further carefully selected EDs without negative impact on population mortality. However, selection of these EDs would require careful consideration.
Introduction
Emergency care in England is under pressure, with demand continuing to increase across the emergency care system. Over the last decade Emergency Department (ED) attendances have increased by 22%,1 and urgent hospital admissions by 42%.2 An average year-on-year increase of 5.2% has also been reported in the number of calls received by the ambulance service.3 Rising demand for emergency care comes at a time when type 1 EDs are facing a staffing shortage. Significant staffing shortages coupled with rising demand may have implications for the quality of care and safety of patients. One solution to this may be to concentrate resources on fewer sites by closing some of these EDs or suspending services overnight. In recent years a small number of EDs have been closed or downgraded to a less acute facility, reportedly due to reasons of inadequate staffing and safety implications. However, there is little research evidence to inform decision-making about closing EDs.
Those opposed to such reorganisation claim that ED closures impact on the quality and safety of care by putting patients at increased risk by decreasing accessibility to care, increasing distances and travel times to care, and worsening patient experience.
As part of a larger study we sought to establish the impact of closing EDs on local populations and on local emergency care providers in five areas of England where there had been a reorganisation of ED care. In doing so, our aim was to provide patients and the public, healthcare providers and policy makers with evidence about the potential benefits and harms of these reorganisations in order to inform decision-making about future ED closures.4
In this paper we seek to quantify the impact of closing or downgrading five EDs on mortality—a key measure of patient safety—focusing on a set of 16 serious emergency conditions (SEC) in which death might sometimes be prevented by a well-performing emergency care system.
Methods
Study design
A controlled interrupted time series analysis of a series of measures was undertaken to quantify the impact of ED closures on the resident catchment populations of five EDs compared with five control areas. A summary analysis of the average effect across all five closure sites versus all five control sites was also undertaken.
Locations
The five EDs which were closed were based in the urban towns of Newark, Rochdale, Bishop Auckland, Hartlepool and Hemel Hempstead in England. At the time of the closure the population size in these towns ranged from 125 000 to 231 000. In each town, an Urgent Care Centre was opened around the time of the ED closure. Emergency care was reorganised in these areas between 2009 and 2011. Documentary analysis suggested that these departments were typically downgraded because of fears about sustainability and future quality of care. Consolidation of emergency care on a smaller number of sites was identified as a way of providing more efficient care resulting in better patient outcomes. Five control EDs were selected to provide a reasonably close sociodemographic/economic match to the intervention area with which it was paired. When selecting a control area we considered a number of variables including: population size, deprivation, age composition, ethnicity and rurality. We were careful to select control EDs that were not served by the same Ambulance Service (because of potential contamination effects) and did not share a geographical boundary with the catchment area of the ED which closed.
Calculation of resident catchment population
In order to undertake the analysis we identified a resident catchment population for each of the 10 areas studied. First, we identified a geographical catchment area for the 10 EDs using Department for Transport (DfT) road travel times. Journey times were modelled by the DfT from the centroid of every Lower Super Output Area (LSOA) in England to every type 1 ED. For each of the EDs which closed and each of the control EDs, the set of LSOAs for which the ED had the shortest travel time was identified and this set of LSOAs was defined as the catchment area of the ED. The resident population of each of the 10 catchment areas was used in the analyses.
Accounting for other changes within the system
Emergency and urgent healthcare systems frequently evolve to meet the changing needs of the population. We needed to account for any major changes to services in the emergency and urgent care system other than the ED closing in the intervention areas or any other major changes occurring in the control areas. Analysis of NHS annual reports in each of the 10 areas identified a number of major changes to emergency and urgent care system delivery including the introduction of NHS 111, the opening or relocation of a primary/urgent care centre and the diversion of emergency ambulances overnight to a neighbouring ED. These changes were included in the analytical models when assessing the impact measures.
Impact measures included
A number of measures were identified as being useful to help understand the impact that ED closures had had on the local population. The primary measures related to mortality which we investigated were:
Out-of-hospital deaths: number of out-of-hospital deaths (ie, death did not occur during an emergency hospital admission episode) from serious emergency conditions, occuring within 7 days of the incident.
Total deaths: total number of deaths from serious emergency conditions occurring out-of-hospital or within 7 days of being admitted to hospital.
Case fatality ratios (CFRs): case fatality ratio for all serious emergency conditions. The CFR is a measure of the risk of death and was calculated as the ratio of total deaths within 7 days, to deaths plus emergency admissions for more than 2 days who survived.
We included raw rather than standardised mortality data because we were looking at the same populations over a short time, rather than comparing different populations and because of uncertainties in the data about the catchment populations needed to do standardisation. The relatively short period of time which we focused on meant that it was unlikely that a demographic population change would be observed.
The serious emergency conditions that were included consisted of a group of 16 clinical conditions which were identified through a Delphi study as conditions from which death might sometimes be prevented by a well performing emergency care system, and which were judged to be useful to use as indicators of emergency and urgent care performance (Box 1).5
Serious emergency conditions
Septic shock
Meningitis
Myocardial infarction
Cardiac arrest
Acute heart failure
Stroke/cerebrovascular accident
Ruptured aortic aneurysm
Asthma
Pregnancy and birth related
Anaphylaxis
Asphyxiation
Fractured neck of femur
Serious head injuries
Any external injury and causes:
Road traffic accidents
Falls (<75 years of age)
Self-harm
Data sources
We obtained Hospital Episode Statistics (HES) Admitted Patient Care (APC) data and Office for National Statistics (ONS) mortality data for the years 2007–2014 from NHS Digital. Estimated journey times by road from LSOA to type 1 EDs were supplied by the DfT in order to establish the ED resident catchment population for each of the 10 areas studied.
Statistical analysis
A controlled interrupted time series approach was used across 48 months (24 months pre and post ED closure). Specifically the data were analysed in three ways:
A time series regression model was fitted to the monthly time series for the closure site using a negative binomial model (for counts of deaths) and a normal model (for the CFRs) to test for preliminary evidence that activity had changed at the time of the ED closure. The negative binomial model was fitted in Stata and the normal model in R using the Prais–Winsten procedure. The models consisted of a season effect, a linear time trend, a ‘step’ term for before and after the time when the site ED was downgraded or closed and a before and after step term for any other potentially significant changes to the emergency healthcare system introduced into the site (Model 1).
Model 1 was built on by adding a control site and comparing the change in the estimated step at the time of closure for the closure site catchment population with the change for the control site catchment population (Model 2).
In the final model, the ‘step model’ (described above) was replaced with a ‘dose model’. Instead of modelling the average effect across the whole of the closure site’s catchment area, the ‘dose model’ made use of the fact that different parts of the catchment area might be differentially affected by the closure of an ED. For example, following a closure, the change in time from LSOA to the nearest ED typically varied from 0 to 25 min. We dichotomised all the LSOAs in the catchment area into ‘high-dose’ areas (with a change in travel time to the nearest ED above the median change in time) and ‘low-dose’ areas (below the median). We then fitted the interrupted time series model as described above but compared high-dose and low-dose areas rather than closure and control areas (Model 6).
We fitted a LOWESS (smoothed) curve through the series of 48 data points representing the monthly activity or performance at each site to help visualise whether there was any change at the time of closure. An example is provided in figure 1.

Example of LOWESS curve: out-of-hospital deaths from serious emergency conditions in residents of areas of Hartlepool expected to have a large change in time to emergency department (‘high-dose') and a small change (‘low-dose').
Finally, for each of the mortality measures, the results from the five individual areas were combined to estimate the average effect of the closure of the five EDs included in this study. Forest plots were used to show the individual site effects, and an overall effect was estimated by combining the individual site estimates using a random effects meta-analysis.
The egative binomial models for counts of deaths model the log of the counts, so the results are reported as the estimated percentage change in the number of deaths at the time of closure of the ED. For the CFRs, the absolute change in the proportion of cases that died is reported. For all analyses we have reported the overall estimate and a 95% CI for this estimate, together with a p value.
Patient involvement
Both at the inception and during this study we were supported by an independent patient and public involvement group: Sheffield Emergency Care Forum. Members of this group were part of our study management team and were able to influence decisions made about how to operationalise the research study, and latterly the interpretation and implication of findings.
Results
Change in journey time from home to ED
The difference between the DfT estimated travel time from each LSOA to the nearest ED and the time to the next nearest ED for residents of LSOAs in the five catchment areas which closed ranged from 0 to 25 min, with a median of 9 min.
Mortality
There were around 19 000 deaths, out-of-hospital or within 7 days of admission, from any of the 16 emergency conditions during the 48 months studied in the five closure sites and five control sites together.
Out-of-hospital deaths
There was no evidence in any area to indicate that the number of out-of-hospital SEC deaths changed at the time of closure/downgrade of the EDs, either in isolation or compared with controls (figure 2). Over all sites, the estimated change relative to the five control areas was +2.2% (95% CI −6.9% to +11.3%; p=0.63) in the number of out-of-hospital deaths.

Change in out-of-hospital deaths in the catchment areas of the emergency departments that closed compared with their control areas.
In relation to the ‘dose model’, there was also no reliable evidence of an increase in risk of out-of-hospital SEC deaths in areas most affected by the closure in terms of time to nearest ED than in areas less affected (figure 3). The estimated effect was a change in high-dose areas relative to low-dose areas of +1.6% (95% CI −9.7% to +12.8%; p=0.78).

Change in out-of-hospital deaths comparing residents of relatively ‘high-dose’ areas with those in relatively ‘low-dose’ areas in that area.
Total deaths
There was also no reliable evidence in any area to indicate that the total number of SEC deaths up to 7 days post-incident changed at the time of closure/downgrade of the EDs, either in isolation or compared with controls (figure 4). Over all sites, the estimated change relative to the five control areas was +2.5% (95% CI −5.2% to +10.2%; p=0.52) in the number of deaths.
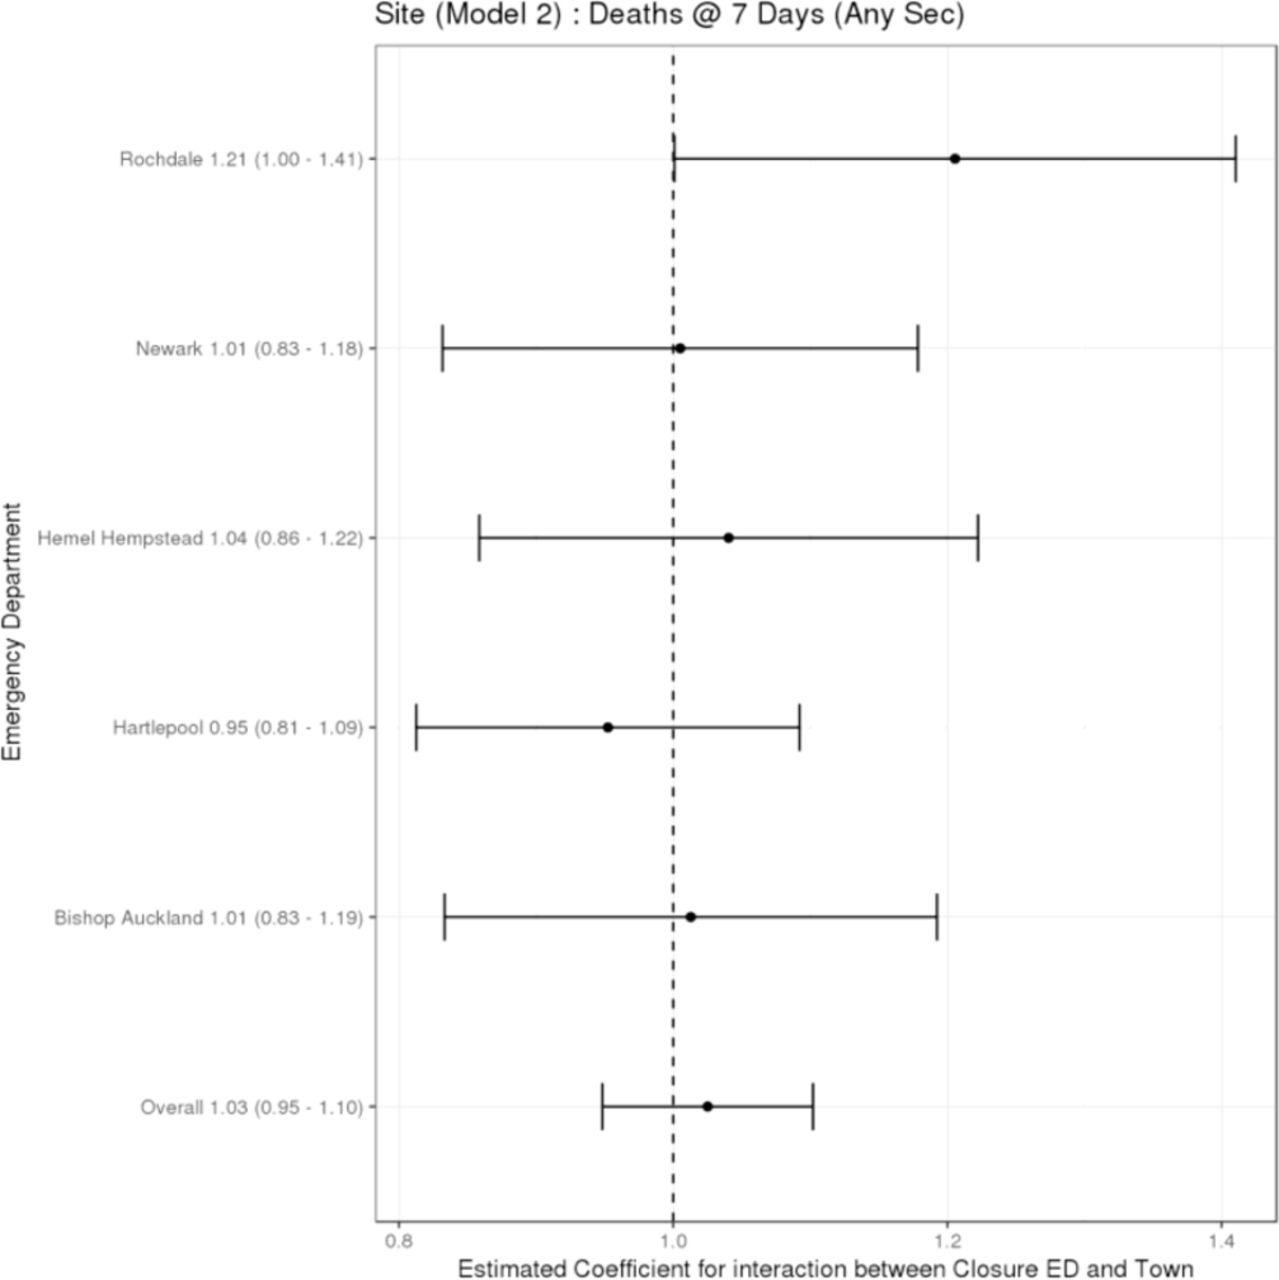
Change in total deaths occurring up to 7 days post-incident in the catchment areas of the emergency departments that closed compared with their control areas.
There was no reliable evidence of an increase in the total number of SEC deaths up to 7 days post-incident in areas most affected by the closure in terms of time to nearest ED compared with areas less affected (figure 5). The estimated effect was a change in high-dose areas relative to low-dose areas of −4.0% (95% CI −13.0% to +5.0%; p=0.39).

Change in total deaths occurring up to 7 days post incident comparing residents of relatively ‘high dose’ areas to those in relatively ‘low dose’ areas in that area.
Case fatality ratios (CFRs)
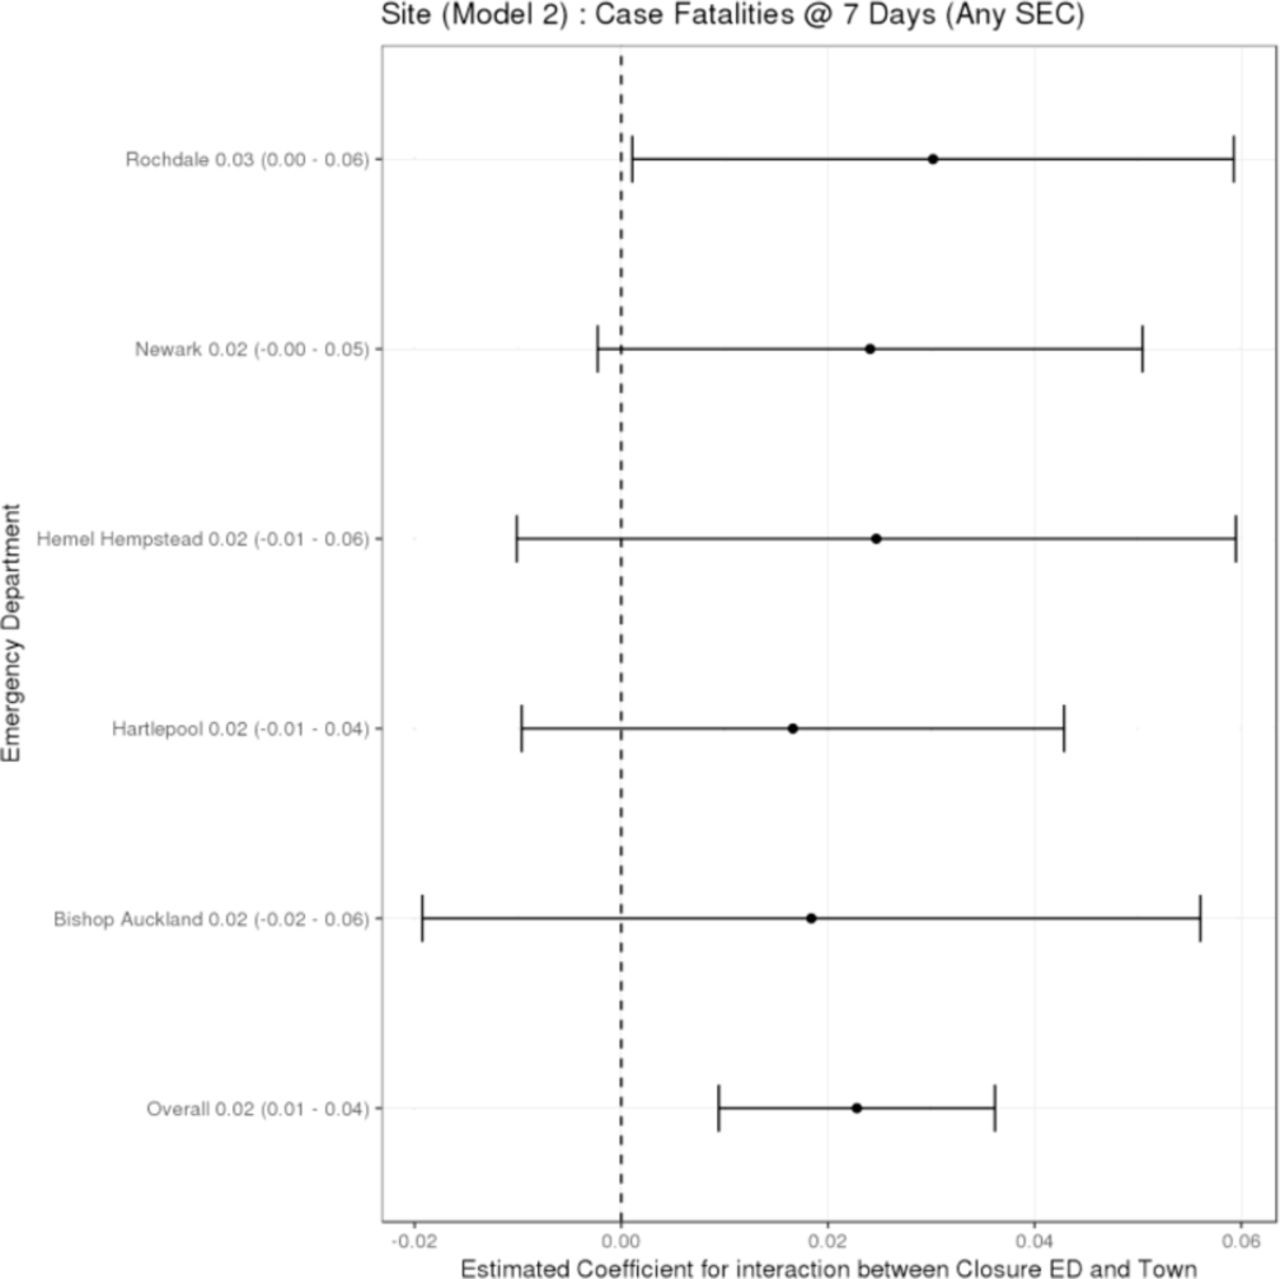
There was no reliable evidence of any change in the CFRs in individual sites, either in isolation or compared with their controls (figure 6). However, over all sites it was estimated that, compared with control sites, there was a small increase in the CFR for deaths within 7 days for the set of 16 emergency conditions following closure of a local ED. The estimated effect was +0.023 (95% CI +0.009 to+0.036; p<0.001), an increase of +2.3 in the percentage of deaths and admissions that were deaths.

Change in the case-fatality ratio in the catchment areas of the emergency departments that closed compared with their control areas.
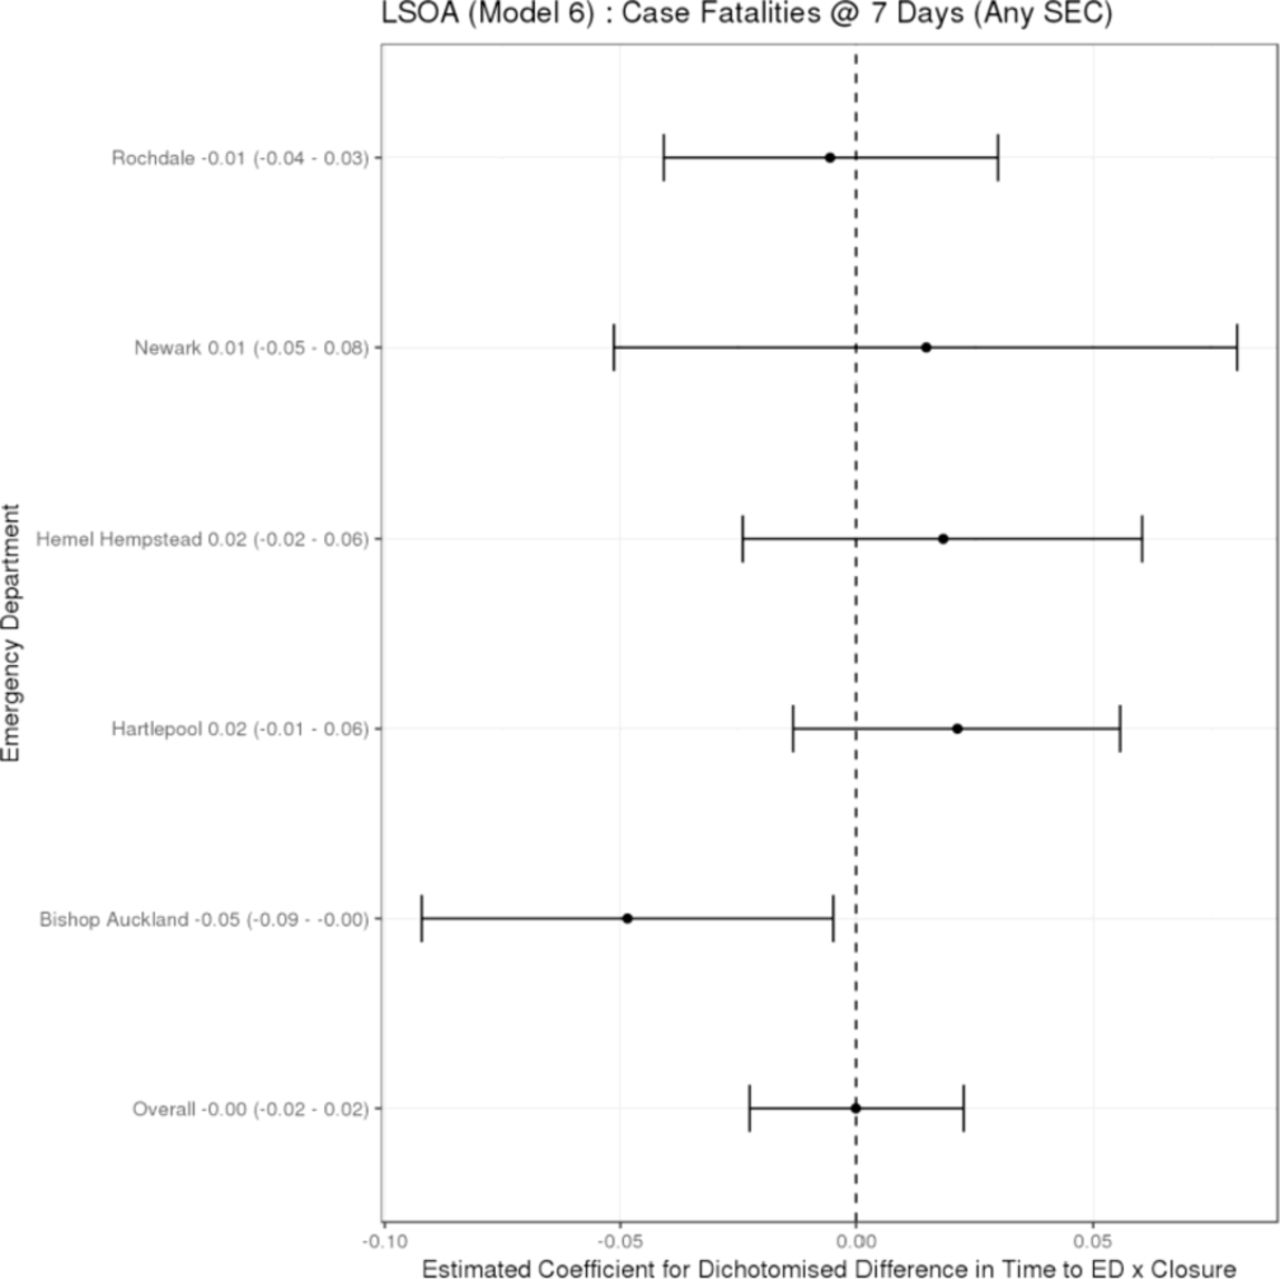
In relation to the ‘dose model’, over all sites it was estimated that there was no change in the CFRs in high-dose areas compared with low-dose areas following closure of the local ED (figure 7). The estimated effect was a change in high-dose areas relative to low-dose areas of 0.000 (95% CI −0.023 to +0.023; p=0.96), representing no change in the percentage of deaths and admissions that were deaths.
Change in the case fatality ratio comparing residents of relatively ‘high-dose’ areas with those in relatively ‘low-dose’ areas in that area.
Table 1 provides a summary of the overall effect for each of the mortality measures by each model of analysis, and shows the direction of change in those areas affected by closure/downgrade.
Summary of overall effect by model
Discussion
Principal findings
We have explored, for the first time, the relationship between closing EDs in England and mortality. We found no reliable evidence that a change occurred at the time of the closure of these EDs in the number of deaths in emergencies, either out-of-hospital or up to 7 days post-incident. There was a small change in one of the measures—namely, the CFR. However, the CFR can change either because the number of deaths changes or because the number of admissions for two or more days changes. Our study found a small decrease in the number of emergency admissions from SEC conditions occurring post-closure,4 which may be the explanation for this finding.
How reliable are these findings?
We have studied approximately 19 000 deaths occurring in 16 conditions over 4 years in five sites and their controls. The 95% CIs showed that there still could have been important changes—either up by +10% or down by −5%—in the number of deaths in emergencies. However, we have some confirmation that the finding of no change is reliable from the dose models we have examined. These models also found no evidence of a worse outcome in those parts of the catchment areas of the EDs that closed that were most affected in terms of increased travel time to ED. Of course, our analysis of ‘dose’ is based on the change in travel time from LSOA of residence to ED, and some of the incidents in the conditions we have studied may have occurred outside the catchment area and so have been unaffected by the ED closing. This effect is probably small but will mean that we have slightly underestimated the true effect for those whose incidents occurred in the catchment area. Rather than using LSOA of residence, we could have used ambulance logs to more accurately identify the location of the incident. However, this would have created a different problem by the fact that some people suffering from chest pain brought on by a heart attack, for example, transport themselves to hospital without using an ambulance. Analysing in-area ambulance incidents would therefore omit some patients whose outcome might have been affected by closure.
The dose models are focused on the impact of a change in time to hospital. However, when an ED is closed or downgraded, the catchment population of the ED is affected in two ways. First, those patients who can no longer get the care they are seeking at the local hospital must travel to an alternative ED. By our definition of the catchment population, this ED is inevitably further away by road travel time. In our study the change in travel time ranged from 0 to 25 min, with a median of 9 min. Since the effectiveness of emergency care is time-dependent,6–8 this means that the outcomes of their care may be worse than before. The second effect arises because they go to a different ED based in a different hospital. This hospital may perform differently to the original ED and hospital in terms of the quality and safety of the care it provides, and so again their outcomes may change.
Our finding that areas that had a big change in time to ED and areas with a small change had similar outcomes suggests that the change in time that we have observed, which is typically of the order of 10 min, has only a small and—in our study—undetectable effect, and that any effect it does have is being compensated by a positive effect of change of place.
Our results may also be dependent on the type of model we have used to describe the data. Although controlled interrupted time series are generally regarded as the gold standard design for observational studies, they are sensitive to the form of the time series model. We have used a simple linear trend and step effect. Both choices were pre-specified in our protocol and were designed to minimise some other problems that can arise from model over-parameterisation. The step effect means that we are estimating the change that occurred at the point of closure. This means that if patients or services had anticipated the closure—for example, by ambulances taking patients to alternative EDs before the closure happened—it could be argued that we have underestimated the total effect of the closure. However, we have not explored alternatives (in the form of sensitivity analyses) because they could not change our conclusion that any impact of closing these EDs was too small to be detected (either because of variability in the data or uncertainties in the model). As with all observational studies, there may be other sources of unknown biases and confounding, and ascribing cause is difficult.
How do our findings fit with previously published evidence?
There is limited evidence on the impact of closing EDs on patient mortality. Most of the existing evidence is from the USA, with its different geography and healthcare system, and focuses on increased journey times or delays in receiving emergency treatment in hospital. With regard to increased journey times, one study found that increased journey times to a Trauma Centre were associated with an increase in inpatient mortality.9 However, this was based on an average increase in journey time of 47 min, significantly longer than in our study. Other studies from the USA, focusing on specific clinical conditions such as myocardial infarction, unintentional injury, stroke or sepsis, have also found an association between increased journey times to hospital and increased risk of mortality.10–13 In the UK, evidence suggests that longer travel distances to unselected hospitals are associated with an increased risk of dying in serious 999 emergencies.14 However, care must be taken over drawing inferences from that study about the impact of closing EDs (in our study) which have been selected.
Further research
While our study determined the impact of closing/downgrading EDs on mortality, there are other opportunities where research could further inform reorganisation. The study relied wholly on routine data and was designed to highlight the effects of ED closure rather than providng understanding as to why the effects were evident. Given that further ED closures are imminent, we see value in undertaking further data collection as reorganisation happens—for example, to understand what processes are used by commissioners and healthcare providers in the implementation of such reorganisation in order to maximise the benefits and minimise any adverse effect on local populations and health services. Using routine data, our study has not been able to explore patients' and carers' perceptions and experiences. We have not carried out any economic assessment of the impact of closure or downgrading, and since many of the proposed closures probably have economic motives as well as clinical motives, this is important. Finally, we have not examined the implications for neighbouring EDs and hospitals that are now taking the patients from the catchment areas of the EDs that closed. We need to understand the implications for crowding, waiting times and safety at these units as well.
Implications
The impact on patient mortality is a key measure when any reorganisation of healthcare takes place. It is of significant importance to the public, healthcare providers and policymakers. The public, in particular, require reassurance that the closure or downgrade of an ED does not result in increased death rates within the population. In the five geographical areas studied here, we found no reliable evidence of an increase in deaths from SECs in the catchment populations following the reorganisation of care.
The decisions to close these EDs may have been taken in the expectation that clinical outcomes could be improved if patients were redirected to other hospitals. Our findings provide no evidence that any such benefits in terms of patient mortality in emergencies accrued.
As noted earlier, we have previously shown that travel distance to hospital is associated with the risk of dying in 999 emergencies.14 However, that study looked at travel distances to a large number of unselected hospitals whereas this study looked at time to selected hospitals. Our findings should not be interpreted as supporting large-scale ED closures in England. The EDs which were selected for closure or downgrading were selected on the basis that there were documented concerns about issues such as their size, staffing and sustainability. Our results should not, therefore, be interpreted as suggesting that any ED can be closed with only small and undetectable effects, but rather if an ED is carefully selected it may be possible to close it without a major impact on mortality.
References
Footnotes
EK and JN contributed equally.
Contributors JN conceived the idea for the study, and along with EK, contributed to the design of the study. JN led the analysis of the data, and was assisted by TS and NS. JN wrote the first draft of the paper. All authors contributed to further drafts and approved the final manuscript.
Funding This work was supported by the National Institute of Health Research (Health Services and Delivery Research Programme) grant number 13/10/42.
Competing interests JN has previously written an article for a newspaper (Mail on Sunday) on the same topic. No payment was made for this article. SM is a member of the HS&DR Commissioning Board.
Patient consent for publication Not required.
Provenance and peer review Not commissioned; externally peer reviewed.
Data availability statement No data are available.
Linked Articles
- Commentary