The science of anthropogenic climate change: what every doctor should know
BMJ 2014; 349 doi: https://doi.org/10.1136/bmj.g5178 (Published 09 September 2014) Cite this as: BMJ 2014;349:g5178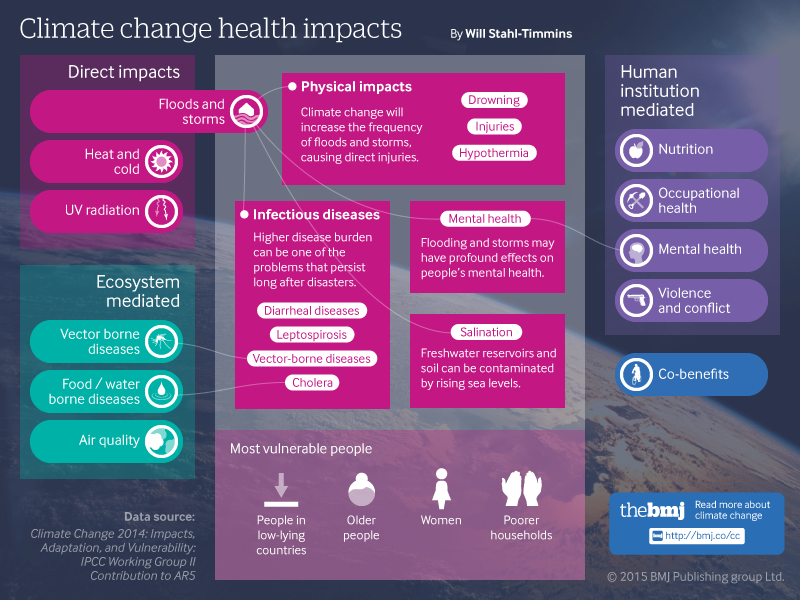 Infographic: Climate change health impacts
Click here to see an interactive graphic, summarising the impacts on health predicted by the Intergovernmental Panel on Climate Change.

- 1Department of Primary Care and Public Health, Queen Mary University London, London, UK
- 2Grantham Institute for Climate Change, Imperial College London, London, UK
- Correspondence to: D McCoy d.mccoy{at}qmul.ac.uk
- Accepted 1 July 2014
Climate change poses a serious threat to social wellbeing and human health. However, there is still considerable misunderstanding and misinformation about global warming and its relation to human activity and climate change. Doctors and health professionals, because of their professional mandate and scientific training, have a potentially important role in ensuring that climate change is properly understood by policy makers and the general public. In light of this, The BMJ asked David McCoy and Brian Hoskins to summarise the key points from a report published by scientific working group 1 of the Intergovernmental Panel on Climate Change (IPCC) on the physical aspects of the climate system and climate change.1
The IPCC is a scientific body (involving thousands of scientists from across the world) that operates under the auspices of the United Nations. Its primary function is to review, assess, and synthesise the most recent scientific, technical, and socioeconomic information relevant to the understanding of climate change. The synthesis is requested by, and presented to, the governments who are part of the UN Framework Convention for Climate Change, though it takes on a wider public importance.
Is the world warming?
The world is undoubtedly warming. This is an empirical and scientifically established fact. Combined land and ocean surface temperature data show an increase of about 0.89°C from 1901 to 2012. This is a best estimate for the increase in temperature and has a 90% confidence interval of 0.69°C to 1.08°C. For the period 1951-2012, the estimated temperature increase is 0.72 (0.49 to 0.89) °C. The past three decades have been significantly warmer than all previous decades with recorded data (fig 1⇓).

Fig 1 Change in globally averaged combined land and ocean surface temperature from a baseline of mean temperature between 1961 and 1990 (green dotted line). Using this baseline, the temperature change is about 0.5°C. However, different baselines give different results and a baseline set to the preindustrial era would result in a temperature change of 0.8-0.9°C. The different coloured lines in both panels refer to the use of different datasets to plot global temperature change
What causes global warming?
Global warming results from a change in the balance of incoming and outgoing energy in the earth-atmosphere system. Essentially, warming results from a decrease in the amount of outgoing heat energy that is lost from the earth-atmosphere system. The primary cause for this is increased atmospheric concentrations of greenhouse gases, which are efficient at absorbing heat given off by the earth’s surface and re-emitting it in all directions, including back towards the earth. This heat trapping effect causes less thermal energy to be radiated back to space, warming the earth. Warming will continue until energy balance is restored.
Is global warming unequivocally the result of human activity?
According to the first working group of the IPCC, it is “virtually certain” that human influence has warmed the global climate system, and “extremely likely” that more than half of the observed increase in global average surface temperature from 1951 to 2010 is related to human activity. Scientists have studied the possibility that global warming has been caused by an increase in the intensity of incoming solar radiation and concluded that changes in solar radiance have had only a small overall warming effect since 1750.
In addition to the emission of greenhouse gases, other aspects of human activity can also affect the balance of incoming and outgoing energy. For example, changes to vegetation and land surface properties can influence the proportion of solar energy that is either retained within the earth-atmosphere system or reflected back towards space. The IPCC concluded that such changes (known as albedo changes) have had an overall small net cooling effect on the earth’s temperature since 1750.
Small particles (such as sulphates, mineral dust, and black carbon) emitted to the atmosphere through human activity can also influence the energy balance. Some reflect solar energy back into space and have a cooling effect, while others help the earth-atmosphere system absorb more energy and contribute to global warming. The net effect is to cool the system, although the size of the effect is uncertain. While the overall cooling effect of these particles (also known as aerosols) may sound beneficial, the distribution of this cooling is different from that of greenhouse gas warming (which is concentrated in the northern hemisphere) and aerosols are also known to have a negative effect on human health, particularly in relation to respiratory disease.
Which greenhouse gases are most responsible for global warming?
Different greenhouse gases contribute to global warming to different degrees. Carbon dioxide is the most important greenhouse gas, followed by methane, nitrous oxide, and certain halocarbons. Consistent with the observed rise in temperatures, the increases in atmospheric concentrations of carbon dioxide, methane, and nitrous oxide are unprecedented in (at least) the past 800 000 years. Concentrations of carbon dioxide, which is long lived, are 40% higher than in pre-industrial times, primarily because of fossil fuel combustion, cement production, and land changes such as deforestation.
Can we be certain about global warming given that temperatures barely rose between 1998 and 2012?
There is clear evidence of a consistent and long term warming trend despite natural variability in temperature from year to year and from decade to decade. The lack of an observed upward trend in temperatures between 1998 and 2012 is a temporary deviation from the longer term trend and has three explanations.
Firstly, natural changes to the pattern of ocean circulation during this period resulted in more heat being transferred from the shallower to the deeper parts of the ocean. This slowed the rate of temperature rise on the land and ocean surface, where most of the surveillance of global temperatures takes place. Secondly, dust particles from volcanic eruptions increased the amount of solar energy reflected back into space during this period. Thirdly, this period of time coincided with a downward phase in the 11 year cycle of fluctuating levels of solar energy entering the earth-atmosphere system.
Ocean circulation is thought to be the most important explanation for the stable temperatures between 1998 and 2012. Such natural variability is also likely to have reinforced the increased greenhouse gas warming in the 1980s and 1990s, leading to the rapid rise in global temperature observed then. Assuming that natural variability continues, a reinforcement and rapid temperature rise can be expected again within the next few decades.
Can we be certain that global warming is causing climate change?
An increase of energy within the earth-atmosphere system will change the earth’s climate. We have good knowledge of the basic physics of the climate system and a good understanding of many climate processes. Supercomputers have been used to model the climate system, and these models have been tested for weather forecasting on time scales from hours to seasons, and by comparison with historical and palaeo-climates. However, attributing and predicting climate change to greenhouse gases is still very challenging.
The climate system is a vast, non-linear, multidimensional, and naturally variable system. It is influenced by many variables and factors that interact with each other in complex ways. Furthermore, limits to the availability, reliability, and consistency of empirical data over both time and space as well as the general unfeasibility of conducting experimental studies on the effect of global warming on the earth’s climate limits our understanding of climate change, especially with respect to making predictions of future climate statistics.
The IPCC has therefore taken great care to describe its methods for interpreting and summarising the evidence and to explain the degree of confidence and certainty associated with its findings and conclusions (box 1).
Box 1: Certainty and confidence
The IPCC expresses the degree of confidence it has in any finding or conclusion in qualitative terms in terms of being high, medium, or low. This is based on the type, amount, reliability, quality, and consistency of evidence as well as on the level of agreement among scientists. It expresses the degree of certainty in a finding or prediction (based on statistical analyses and model results, and expert judgment) in both qualitative and quantitative terms accordingly:
-
Virtually certain (99-100% probable)
-
Very likely (90-100% probable)
-
Likely (66-100% probable)
-
About as likely as not (33-66% probable)
-
Unlikely (0-33% probable)
-
Very unlikely (0-10% probable)
-
Exceptionally unlikely (0-1% probable)
What do we know about climate change?
Notwithstanding the scientific limitations noted above, the IPCC Working Group 1 report contains over 1000 pages of summarised evidence on many aspects of climate change that can be attributable (with varying degrees of certainty and confidence) to global warming. Only a brief summary of this evidence is presented here. As a general point, it is important to note that there is considerable regional variation associated with climate change, and some parts of the world can show opposite trends to others.
Temperature extremes
The frequency and intensity of daily temperature extremes have increased since the mid-20th century, and it is very likely that human influence has contributed to this. The numbers of cold days and nights have decreased and the numbers of warm days and nights increased in most parts of the globe. And there has been an increase in the length and frequency of heat waves in parts of Europe, Asia, and Australia. But temperatures have cooled in a few areas (such as central North America), probably because of changes in the hydrological cycle and land-atmosphere interaction as well as because of natural variability.
Rainfall
A warmer atmosphere can, and usually does, contain more water vapour. For example, air that is 6°C warmer can contain about 50% more water. This means that the same storm in a warmer world will have more water in the air flowing into it and will therefore produce heavier precipitation. Since 1950, the number of heavy precipitation events over land has increased in more regions than it has decreased. There has also been an increase in the frequency or intensity of heavy precipitation in North America, Central America, and Europe and evidence of increased flooding in northern high latitudes. At the same time, because of physical constraints on total global rainfall change, the propensity towards drought has increased in some areas (fig 2⇓).

Fig 2 Observed change in annual precipitation over land
Weather events
Changes to various aspects of the global weather system have now been observed, although the extent to which these changes are linked to greenhouse gas climate change rather than to natural variability is uncertain. These changes include widening of the tropical belt, weakening of the East Asian monsoon, and shifts in the direction and intensity of the North Atlantic cyclone tracks. Among the effects are changes in the pattern of extreme weather events. For example, it is “virtually certain” that the frequency and intensity of the strongest tropical cyclones in the North Atlantic have increased since the 1970s and that cyclone frequency, duration, and intensity have grown in the western North Pacific.
Melting
The earth’s cryosphere (the frozen parts of the planet) has been shrinking as a result of melting. The amount of ice contained in glaciers globally has declined every year for more than 20 years. Substantial Arctic warming has led to large losses in the amount of Arctic sea ice throughout the year (fig 3⇓). Counterintuitively, the area of Antarctic sea ice has tended to increase. This is explained (in brief) by the fact that Antarctica is a higher land mass surrounded by ocean and influenced more by stratospheric ozone depletion than the Arctic.

Fig 3 Arctic summer sea ice extent. The different coloured lines refer to different datasets while the shaded areas refer to the confidence intervals of the averaged measures of arctic summer sea ice extent
The extent of northern hemisphere snow cover has also decreased since the mid-20th century (very high confidence) and many parts of the high latitude areas of the northern hemisphere have experienced reductions in the thickness and area of permafrost (the layer of soil or rock in the ground that is frozen all year round).
Sea level rise
Global warming has resulted in a rise in the global mean sea level (fig 4⇓), with the rate of rise having increased in recent years. Most of the rise since 1900 has been due to thermal expansion of the ocean and glacier melting. From satellite gravity measurements we can now be sure that reductions in both the Greenland and Antarctic ice sheets are also making a significant contribution to current rises in sea level.

Fig 4 Change in global average sea level. The different coloured lines refer to different datasets
Are there other effects associated with greenhouse gases?
In addition to their warming effect, the rise in atmospheric concentrations of carbon dioxide has led to acidification of the oceans; with the pH of ocean surface water having decreased by 0.1 since the beginning of the industrial era (high confidence). It is also “very likely” that the salt content in the world’s oceans has changed as a result of changing patterns of evaporation and precipitation.
What other factors influence climate change?
Climate change caused by greenhouse gas emissions is amplified by other forms of human activity. For example, large scale deforestation affects weather patterns independently of its contribution to the release of greenhouse gases. Similarly, other forms of ocean pollution add to the effect of ocean acidification by altering the overall chemistry and ecosystem of the oceans. It is therefore important to look at the full spectrum of human influences on the planet’s ecosystems, not just at those caused by greenhouse gas emissions.
What can we say about future climate change?
The pattern of future climate change will largely depend on the trajectory of greenhouse gas emissions as well as the actual sensitivity of global temperature to greenhouse gases. The emissions trajectory will be influenced by a wide range of factors, including future energy policy and consumption; changes in agriculture, dietary patterns, and land use; rates of economic development and population growth; and the development and use of carbon capture and storage technologies. Consequently, climate projections are made on the basis of specified future scenarios.
The IPCC report uses four future scenarios (called representative concentration pathways or RCPs) representing different trajectories of atmospheric concentrations of greenhouse gases and aerosols up to the year 2100. Each scenario has a different balance of incoming and outgoing energy in the earth-atmosphere system over time and thus a different projected pattern of temperature change. The effect of greenhouse gases and aerosols on the energy balance is called radiative forcing and is measured in Watts per square meter (W/m2). The four RCPs have been labelled according to the radiative forcing projected for each scenario by 2100. Hence, they are known as RCP2.6, RCP4.5, RCP6.0, and RCP8.5.
Figure 5⇓ describes the future emissions of the three main greenhouse gases for each scenario; while figure 6⇓ shows the expected trajectory for global temperature change given by the climate models for each RCP, again with a best estimate and a range. The RCP2.6 scenario assumes a radical reduction of greenhouse gas emissions starting almost immediately and is accompanied by a slow rate of temperature increase that eventually plateaus. By contrast, the RCP8.5 scenario assumes more or less unabated emissions and will result in a continued rise in global temperatures.

Fig 5 Projected emissions of main greenhouse gases for the four IPCC representative concentration pathways. Redrawn from van Veuren et al2

Fig 6 Projected trajectory of global temperature change for RCP8.5 and RCP2.6 relative to 1986-2005. The shaded areas on either side of the bold lines indicate the range of the model predictions of projected future temperature
Table 1⇓ shows the projected median temperature rise for each scenario relative to 1986-2005. Even for the strong mitigation scenario (RCP2.6), global warming will continue and the temperature is expected to rise a further 1°C by the middle of the 21st century. For the unabated emissions scenario (RCP8.5), the projected median temperature rise by the middle of this century is 2°C and 3.7°C towards the end of the century. This is about 4.3°C above the pre-industrial value.
Projected rise (95% confidence interval) in global mean surface air temperature by the mid and late 21st century relative to the reference period of 1986-2005 for IPCC’s four representative concentration pathways (RCPs)*
Although the global average temperature is an important metric for assessing the overall extent of climate change, regional variation in temperature is considerable. Figure 7⇓, for example, gives the geographical pattern of warming for the latter part of the 21st century under the RCP2.6 and RCP8.5 scenarios. While the patterns are similar for both scenarios, the amplitudes are clearly different. In each case the continents warm more than the oceans, and the northern continents warm even more. For RCP8.5, the tropical continents warm by some 5°C and the northern continents by more than 10°C. There will be a general increase in hot extremes and decrease in cold extremes.

Fig 7 Change in average temperature (1986−2005 to 2081−2100) for RCP2.6 and RCP8.5.
What do the different RCP scenarios mean in practice?
The RCP scenarios used by the IPCC represent only four of multiple possible scenarios. However, they provide a rigorous basis for scientists to examine future climate change under different greenhouse gas emissions scenarios; while illustrating specific social, demographic, economic and energy use conditions that would accompany those emissions scenarios. For example, the RCP8.5 scenario assumes high population growth and lower income growth in developing countries, whereas the RCP2.6 scenario assumes higher and more equitable income growth, with population growth plateauing below nine billion. Each of the four scenarios specifies a different mix of energy sources and consumption patterns (fig 8⇓), as well as alternative agriculture and land use activities.

Fig 8 Energy sources by sector for each RCP in 2100 compared with 2000. Redrawn from van Veuren et al2
What will future climate change be like?
Unless global greenhouse gas emissions start to fall within the next decade, we can expect to see further and more drastic changes to the weather and climate across the world. We will give only a selected and brief account of these predictions here.
Rainfall is generally projected to increase in the wet tropics and in the warmer high latitudes and to decrease in the dry subtropics. Heavy precipitation events are also projected to increase in intensity. Aided by the extra drying in a warmer world, as seen in fig 9⇓, the soil moisture for RCP8.5 is projected to decrease significantly by the end of the century in many regions, notably the southwest of the United States, southern Europe, the Amazon, southern Africa, and Australia.

Fig 9 Change in average soil moisture (1986-2005 to 2081-2100) for RCP8.5
The earth’s cryosphere will also continue to melt as global mean surface temperature rises. By the end of the 21st century, the global glacier volume is projected to decrease by 15-55% for RCP2.6, and by 35-85% for RCP8.5 (medium confidence), and Arctic sea ice cover is projected to continue shrinking. Under RCP8.5, the Arctic ocean would be likely to be nearly ice-free in September by the middle of this century (medium confidence). It is also “very likely” that northern hemisphere snow cover will reduce over the coming century and that permafrost will retreat.
It is “very likely” that the global mean sea level will rise at a greater rate during the 21st century than during 1971-2010 for all RCP scenarios because of thermal expansion and loss of mass from glaciers and ice sheets (fig 10⇓). There will also be a significant increase in the occurrence of “sea level extremes” (mainly coastal flooding and storm surges generated by cyclones).

A global increase in ocean acidification is projected for all RCP scenarios (fig 11⇓), but the increase is very limited for RCP2.6 and substantial for RCP8.5. As with other effects of greenhouse gases, there will be important regional variations

What do these projections tell us about the need to mitigate climate change?
International policy discussions have suggested that to avoid dangerous climate change, the rise in global temperatures from the pre-industrial period should be kept below 2°C. This target is likely to be exceeded in RCP6.0 and RCP8.5 and is more likely than not to be exceeded in RCP4.5.
The principal driver of long term warming is carbon dioxide. Because it stays in the atmosphere for centuries, our emissions accumulate. Table 2⇓ shows the maximum cumulative carbon dioxide emissions required to limit global warming to less than 2°C for different levels of certainty. To limit the warming caused by anthropogenic carbon dioxide emissions so that it is likely to be less than 2°C cumulative carbon emissions would have to be about 1000 GtC (1 Gt =1 g×1015), more than half of which had already been emitted by 2011. When the effects of other greenhouse gases are factored in, the total cumulative carbon dioxide budget available is estimated to be about 790 GtC.
Cumulative carbon dioxide budget required to limit global warming to less than 2°C at different levels of chance
Presently however, rates of carbon dioxide emissions are rising. In 2011, annual CO2 emissions from fossil fuel combustion and cement production were about 9.5 Gt/year (8.7 to 10.3 Gt/year), while net carbon dioxide emissions from anthropogenic land use change was about 0.9 Gt/year (0.1 to 1.7 Gt/year) averaged across 2002 to 2011. Based on these figures, at current rates of emission it would take us only 25-30 years to reach the 790 GtC limit.
What are the implications for health professionals?
Given widespread public misunderstanding and scepticism about climate change and lack of appreciation of the dangerous experiment we are performing on our planet, we hope this article will inform doctors and encourage and enable them to play their part in informing the public about climate change.
Because they are trained to impart information to patients about disease and illness, health professionals are well placed to explain and describe climate change as a symptom of planetary stress and ill health. The parallels between human and planetary health provide many opportunities for enabling a more thoughtful public discussion of climate change.
Greenhouse gas emissions and other forms of human activity such as deforestation are having profound effects on the earth. More importantly, it is increasingly clear that climate change poses a major (direct and indirect) threat to human health worldwide, as well as to biodiversity more generally.
However, despite the IPCC’s unequivocal statement that substantial and sustained reductions of greenhouse gas emissions are required to prevent further disruption and destabilisation of the earth’s climate, greenhouse gas emissions are actually rising across the world, and in some parts, at an accelerating rate. This runs against the grain of scientific evidence and common sense.
The precautionary principle—which forms a core part of normal public health practice—is important here. Put simply, it states that, should an activity raise threats of harm to human health or the environment, precautionary measures should be taken even if some cause and effect relations are not fully established scientifically. Although the international climate convention refers to the precautionary principle, it seems to have been widely ignored. Doctors and health professionals can help to change this.
Notes
Cite this as: BMJ 2014;349:g5178
Related links
Footnotes
-
Competing interests: We have read and understood BMJ policy on declaration of interests and declare the following: BH is a member of the IPCC’s Working Group 1 and DM is chair of Medact, a registered charity that promotes sustainable and equitable development.
-
Provenance and peer review: Commissioned; not externally peer reviewed.